97
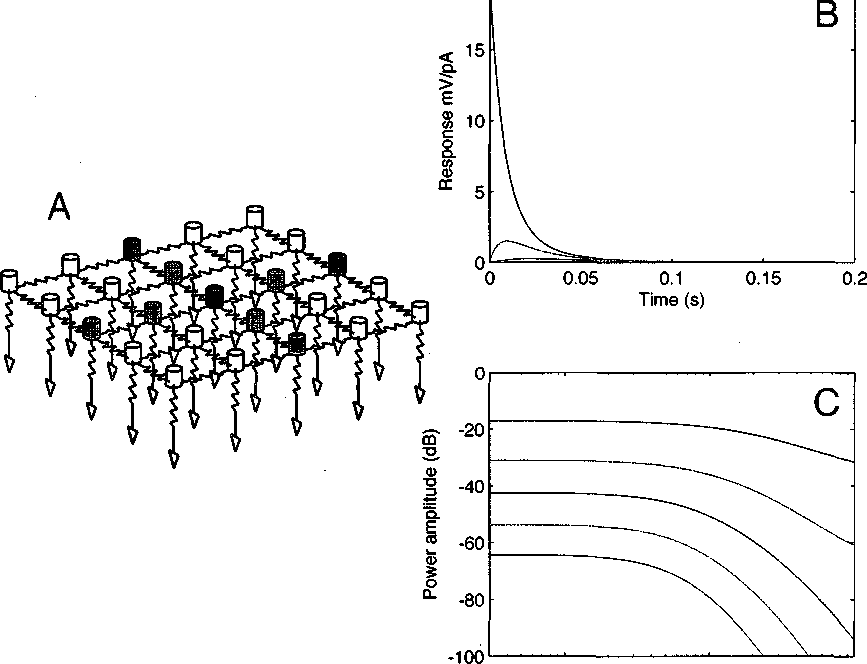
originating rod. The frequency response plot (figure 5.8) shows that signals changing slower
than ≈ 1 Hz can be considered to be unaffected by the capacitive filtering.
20
10° 101 102
Frequency (Hz)
Figure 5.8 : (A) Diagram of the network with colored cells and their corresponding traces in
A and B. (B) Impulse response and Bode plot of corresponding (C) frequency response of
colored cells in response to a signal in the center (blue) cell in power dB = 10 log (mV∕pA)2.
More intriguing information
1. The name is absent2. The name is absent
3. A multistate demographic model for firms in the province of Gelderland
4. The name is absent
5. The name is absent
6. Multi-Agent System Interaction in Integrated SCM
7. A Rational Analysis of Alternating Search and Reflection Strategies in Problem Solving
8. Do the Largest Firms Grow the Fastest? The Case of U.S. Dairies
9. Managing Human Resources in Higher Education: The Implications of a Diversifying Workforce
10. The Role of Trait Emotional Intelligence (El) in the Workplace.