42
frequency response is given in Appedix A.2. Plotting the model predicted frequency re-
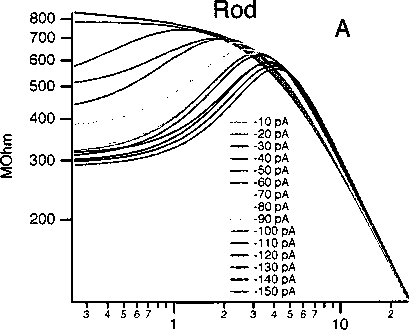
sponse demonstrates the shift in peak response for rods and cones with increasing stimulus
strength (figure 3.7 A,B). These shifts, from about 2-4 Hz for rods, and from 1.5-3.5 Hz for
cones, suggest that the HCN channels work to extend the operational frequency range for
both rod and cone photoreceptors. This effect, along with the bandpass filter response, helps
to quicken the voltage response of photoreceptors. ∙
Hz
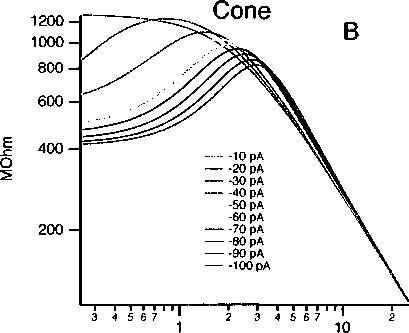
Figure 3.7 : Model (figure 6) predicted frequency response to electrical stimuli. (A) Fre-
quency response of a rod photoreceptor predicted by the inductive model for each input
magnitude. (B) Frequency response of cone photoreceptor. This demonstrates the HCN-
mediated bandpass filter response of rods and cones at different input magnitudes. The
resonant frequency shifts from 1 Hz to around 4 Hz for both rods and cones.
3.3.4 HCN channel shaping of photocurrent
Up to this point we have shown that the single channel conductance, whole-cell current,
and electrical characteristics of the ∕⅛ current are very similar in rods and cones. However,
results using light stimuli demonstrate that the effect of HCN channels on the light response
More intriguing information
1. Integration, Regional Specialization and Growth Differentials in EU Acceding Countries: Evidence from Hungary2. The name is absent
3. The name is absent
4. The name is absent
5. Valuing Access to our Public Lands: A Unique Public Good Pricing Experiment
6. Human Resource Management Practices and Wage Dispersion in U.S. Establishments
7. Getting the practical teaching element right: A guide for literacy, numeracy and ESOL teacher educators
8. The name is absent
9. An Attempt to 2
10. Three Strikes and You.re Out: Reply to Cooper and Willis