45
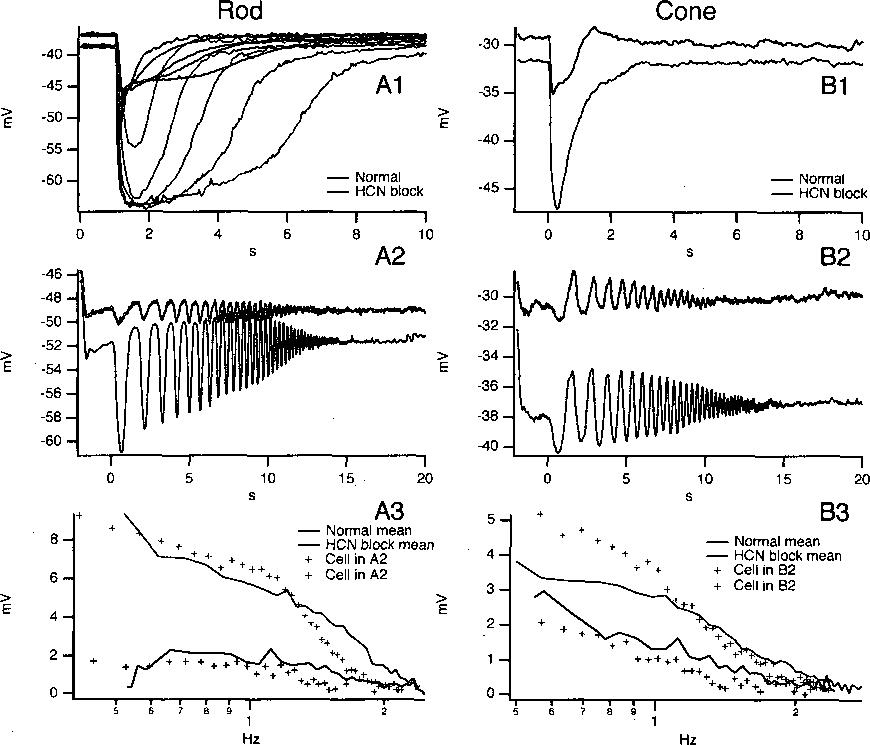
Figure 3.8 : (Al) Normal rod light response to flashes of increasing light intensity. (Bl) Nor-
mal cone response to a flash of light. Response to the same stimulus after blocking HCN
channels with ZD 7288 is shown in red. (A2) Rod and (B2) cone response to frequency-
chirped light stimulus before and after HCN block. (A3) and (B3) demonstrate the ampli-
tude vs frequency for chirped light stimuli. Solid lines show population means (n=4 for A3
and n=3 for B3), while crosses show the data for traces shown in A2 and B2, respectively.
When HCN channels are blocked, a steady decay in the frequency response of both rod and
cone photoreceptors, at dim and bright light intensities respectively.
More intriguing information
1. Brauchen wir ein Konjunkturprogramm?: Kommentar2. Geography, Health, and Demo-Economic Development
3. The name is absent
4. Credit Markets and the Propagation of Monetary Policy Shocks
5. Improving the Impact of Market Reform on Agricultural Productivity in Africa: How Institutional Design Makes a Difference
6. BILL 187 - THE AGRICULTURAL EMPLOYEES PROTECTION ACT: A SPECIAL REPORT
7. Staying on the Dole
8. Automatic Dream Sentiment Analysis
9. The name is absent
10. An Efficient Secure Multimodal Biometric Fusion Using Palmprint and Face Image