The variable surface charge density was included in the simulation as follows. With the
tip at Do, we ran the simulation using the surface charge density obtained from applying
the method described in Chapter 2, this is the Imperturbed surface charge density σo. We
then set the tip at Di, (Di = Dq- 0.5 nm) and set the surface charge density to σj. Here, σ/
was calculated as a function of the lipid surface potential underneath the tip ψo, when the
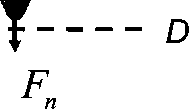
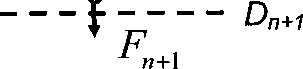
tip was at Do- We ran the simulation with Di, σj and then repeated the same procedure for
D2, D3 ,...,Dn , Dn+ι as shown in the schematic in Figure 3.6, with Dn+ι = Dn- 0.5 nm
AFM TIP

σn Ψn

AFM TIP
Яш
&n+l Ψ n+1
LIPID BILAYER
LlPlD BILAYER
σn+l = g(ψn )
Figure 3.6: Schematic of how the tip-induced charge regulation finite element model is
implemented. Here, ψ is the surface potential, σ is the surface charge density of the lipid
bilayer and F is the electrostatic force on the tip. The functional form of g will depend on
the form of charge regulation being considered (e.g. charge regulation due to counterion
binding).
33
More intriguing information
1. How much do Educational Outcomes Matter in OECD Countries?2. Yield curve analysis
3. Evolution of cognitive function via redeployment of brain areas
4. LAND-USE EVALUATION OF KOCAELI UNIVERSITY MAIN CAMPUS AREA
5. The name is absent
6. The name is absent
7. The name is absent
8. Quelles politiques de développement durable au Mali et à Madagascar ?
9. The name is absent
10. DEVELOPING COLLABORATION IN RURAL POLICY: LESSONS FROM A STATE RURAL DEVELOPMENT COUNCIL