450
400
----Felec + Fvdw
.............Felec
---AFM data
2 4 6 8 10 12 14
Tip-sample separation D (nm)
350
300
⅛ 250
ц.
200
150
100
50
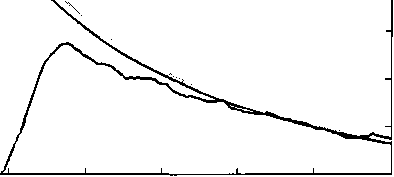
Figure 3.7: Comparison of the AFM data with the van der Waals computational model.
The AFM data and the electrostatic simulation shown here are the same as in Figure 3.2.
As seen in Figure 3.7, the inclusion of the van der Waal attraction does not account for
the discrepancy in the previous model. Even when unrealistically large values of Ли were
used (several orders of magnitude larger than the actual Ah) we were not able to see a fit
to the experimental data.
3.3.2 Charge regulation due to counterion binding; Iipids vs. silicon nitride
In the Gouy-Chapman-Stem (GCS) theory of lipid membrane electrostatics, a source of
charge regulation is the binding of counter ions onto the charged headgroups of the lipids.
In applying the GCS model to our system, electrolyte cations bind to the PS headgroups
to form a Stem layer. The cation binding is described by a Langmuir isotherm and the
effect of the surface potential on the cation surface concentration is taken into account.
35
More intriguing information
1. What Contribution Can Residential Field Courses Make to the Education of 11-14 Year-olds?2. Locke's theory of perception
3. The name is absent
4. Corporate Taxation and Multinational Activity
5. The name is absent
6. Towards Teaching a Robot to Count Objects
7. The name is absent
8. The name is absent
9. The mental map of Dutch entrepreneurs. Changes in the subjective rating of locations in the Netherlands, 1983-1993-2003
10. Accurate, fast and stable denoising source separation algorithms