Figure 3.16: AFM topography image of a 1:9, DMPC:DMPS Iipid patch. (Left)
Topographie image of the lipid bilayer. (Right) Charge map of the same area showing the
charge contrast between the lipid and the mica. The scan size is Ixl μm.
Figure 3.16 is an example of a FEFM image with significant charge contrast, in this case
between mica and an anionic lipid patch.
We prepared 4-lipid gel∕fluid mixtures and performed FEFM scans of them. Figure 3.17
shows such a sample. As can be seen in the right panel of Figure 3.17, we do not find
discernable charge contrast between the gel and the fluid phase areas.
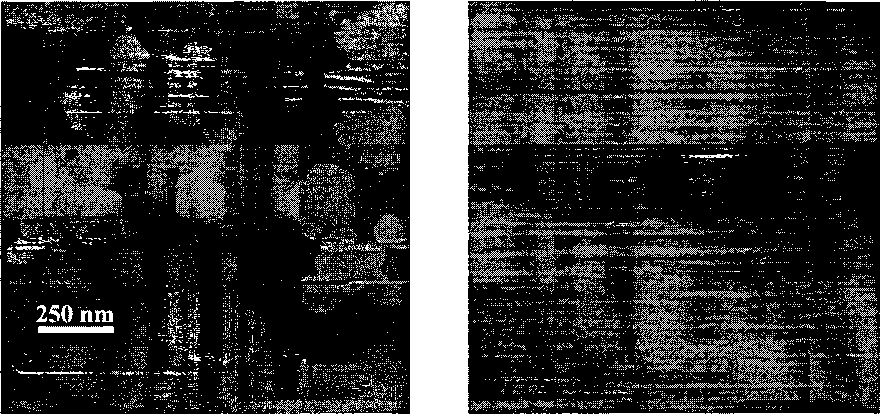
Figure 3.17: FEFM imaging of the DOPC:DOPS:DMPC:DMPS mixture. (Left)
Topography of the lipid mix, the lighter colors represent taller features. (Right) The
charge map of the same region showing no discernable charge contrast. The scan size is 2
x 2 μm.
45
More intriguing information
1. The Response of Ethiopian Grain Markets to Liberalization2. The name is absent
3. Howard Gardner : the myth of Multiple Intelligences
4. How does an infant acquire the ability of joint attention?: A Constructive Approach
5. Spatial patterns in intermunicipal Danish commuting
6. Uncertain Productivity Growth and the Choice between FDI and Export
7. Beyond Networks? A brief response to ‘Which networks matter in education governance?’
8. The name is absent
9. Comparative study of hatching rates of African catfish (Clarias gariepinus Burchell 1822) eggs on different substrates
10. The name is absent