|
__________________TABLE 1: DESCRIPTIVE STATISTICS__________________ | |||
|
VARIABLES ► |
PER HEAD |
PER HEAD HEALTH |
EDUCATION |
|
DESCRIPTIVE STATISTICS ⅛, | |||
|
Mean_____________________ |
24220.83 |
________________1898.10 |
0.9669~ |
|
Standard Deviation______________ |
23546.06 |
_______________2466.27 |
_________0.1795 |
|
Coefficient of Variation__________ |
___________0.97 |
___________________________1.3 |
____________0.19 |
|
Highest Value__________________ |
140000.00 |
______________13100.00 |
____________1.00 |
|
Lowest Value_________________ |
_______2250.00 |
_________________137.50 |
____________0.00 |
|
Range______________________ |
137750.00 |
_______________12962.50 |
____________1.00 |
Source: Compiled from Primary Data
To find out the impact of household income and education of the head of the household
on the pattern of health expenditure (PHE) a linear regression model is fitted (see Table 2 and
Figure 1) as PHE = -696.046 + 0.82PHI + 0.03EDN with R2 value 0.68, which indicates that a
rupee increase in income brings about 82 paise increase health expenditure of a person and an
educated person on an average spends three paise more in a rupee than the uneducated person on
health expenditure.
In both rural and urban areas
income has positive influence on
health expenditure but the influence is
more in urban area than rural area. In
finding out the influence of education
on health expenditure, it is found that,
in both rural and urban areas, an
educated person on an average spends
three paise more in a rupee than the
uneducated person (Rout, 2005). It indicates that education has same impact on health
expenditure irrespective of rural and urban areas.
Figure 1
Relationship between PHI and PHE
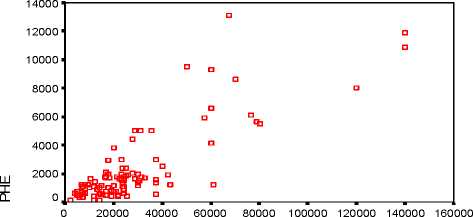
PHI
Source: Primary Data
TABLE 2
REGRESSION OUTPUT: ANOVA
|
Sum of Squares |
df |
Mean Square |
F |
Sig. |
R2 |
Std error |
D-W Stat. | |
|
Regression |
497127930.086 |
___2 |
248563965.04 |
126.008 |
.000 |
.68 |
140.4945 |
1.634 |
|
Residual |
232767381.533 |
188 |
1972604.928 | |||||
|
Total_______ |
729895311.619 |
120 |
a Predictors: (Constant), EDN, PHI
b Dependent Variable: PHE
More intriguing information
1. On the job rotation problem2. The Prohibition of the Proposed Springer-ProSiebenSat.1-Merger: How much Economics in German Merger Control?
3. EU enlargement and environmental policy
4. The name is absent
5. Creating a 2000 IES-LFS Database in Stata
6. Washington Irving and the Knickerbocker Group
7. Using Surveys Effectively: What are Impact Surveys?
8. Delivering job search services in rural labour markets: the role of ICT
9. Input-Output Analysis, Linear Programming and Modified Multipliers
10. THE ECONOMICS OF COMPETITION IN HEALTH INSURANCE- THE IRISH CASE STUDY.