Figure 20. Happiness and Income over Time in the United States
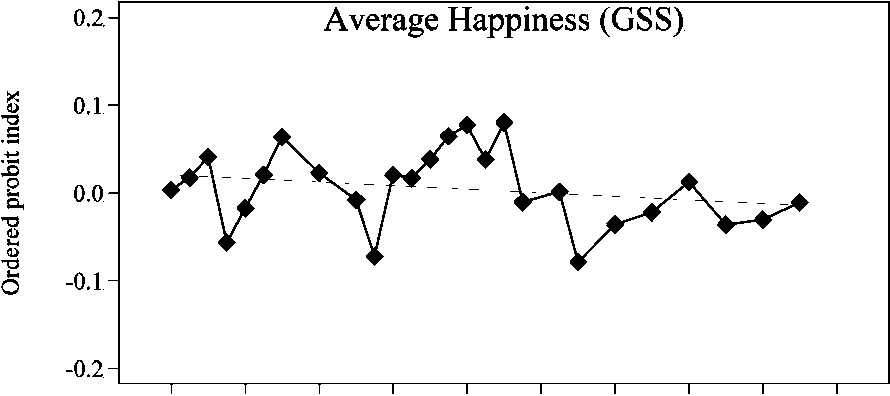
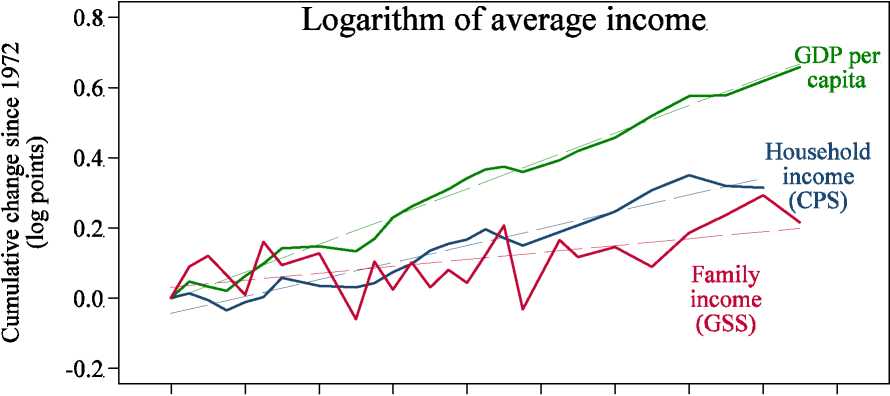
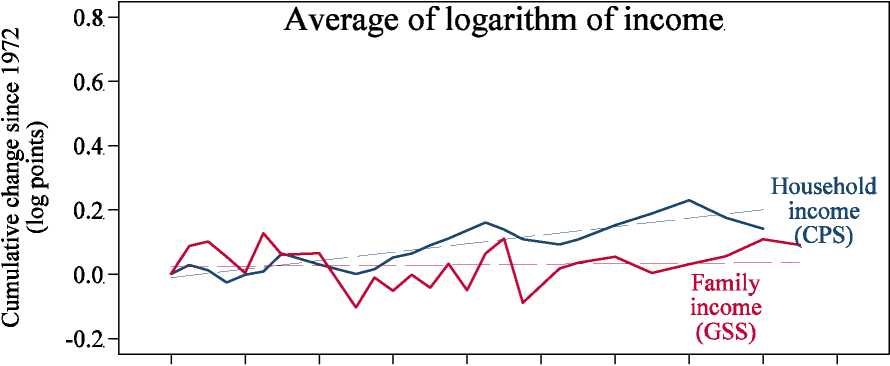
1972 1976 1980 1984 1988 1992 1996 2000 2004 2008
Sources: General Social Survey; Current Population Survey; Bureau of Economic Analysis.
Notes: Happiness index is described in figure 13.
Figures—20
More intriguing information
1. Skill and work experience in the European knowledge economy2. Types of Cost in Inductive Concept Learning
3. THE WELFARE EFFECTS OF CONSUMING A CANCER PREVENTION DIET
4. LOCAL CONTROL AND IMPROVEMENT OF COMMUNITY SERVICE
5. The Role of Land Retirement Programs for Management of Water Resources
6. The Challenge of Urban Regeneration in Deprived European Neighbourhoods - a Partnership Approach
7. The name is absent
8. EXECUTIVE SUMMARIES
9. HOW WILL PRODUCTION, MARKETING, AND CONSUMPTION BE COORDINATED? FROM A FARM ORGANIZATION VIEWPOINT
10. Optimal Tax Policy when Firms are Internationally Mobile