Figure 17. Trends in Life Satisfaction in the European Union
0.2
x
-g 0.1
с
S
2
I o∙o
о
I -0.1.
Cd
GO
-0.2
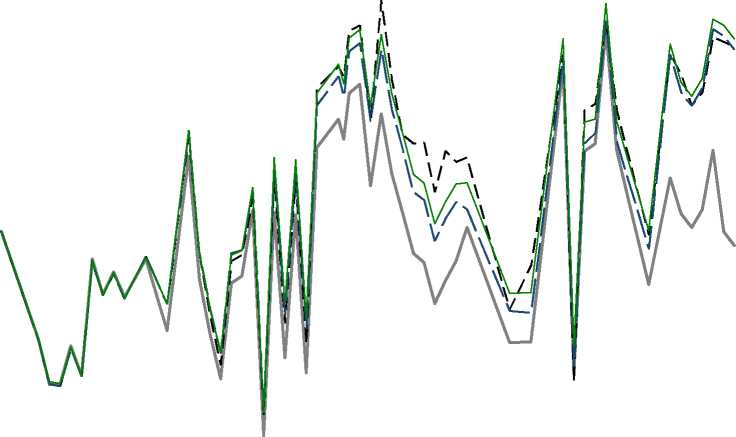
Average of a changing EU.
Spliced fixed-weight series
— EU-9 average.
--- Regression-adjusted
1972 1976 1980 1984 1988 1992 1996 2000 2004 2008
Source: Eurobarometer, 1973-2007.
Notes: Lines depict alternative aggregations of semiannual time series of life satisfaction for each country, derived by running an ordered probit of satisfaction on country × wave fixed
effects. “Average of a changing EU” is calculated by taking a population-weighted average of the satisfaction indices for the set of countries that were members of the European Community
or the European Union at the indicated point in time; and hence the average is affected by changes in the group’s composition. “EU-9 average” is calculated by taking a fixed-weight
average of the satisfaction indices of the nine members of the European Community at the beginning of the sample: Belgium, Denmark, France, West Germany, Ireland, Italy, Luxembourg,
the Netherlands, and the United Kingdom; weights reflect the average population share of each country in the group. ”Spliced fixed-weight series” simply sums through time first
differences in the broadest available fixed-weight average of satisfaction in the member nations; consistent fixed-weight indices were calculated separately for each constellation through the
sample: EU-9 (summer 1973-fall 2007), EU-10 (adding Greece, from 1981 onward), EU-12 (adding Portugal and Spain, from 1986 onward), EU-12+ (adding East German surveys, from
the fall 1990 survey onward), EU-16 (adding Austria, Finland, and Sweden from 1995 onward), EU-26 (adding Cyprus, the Czech Republic, Estonia, Hungary, Latvia, Lithuania, Malta,
Poland, Slovakia, and Slovenia from the fall 2004 survey onward), and EU-27 (adding Bulgaria and Romania, from 2007 onward). Population weights for each index reflect the average
population share of each country in that aggregate. “Regression-adjusted” index is the series of time fixed effects estimated by running a population-weighted OLS regression of individual
country satisfaction indices on survey time fixed effects, controlling for country fixed effects
Figures—17
More intriguing information
1. The name is absent2. The name is absent
3. Migration and employment status during the turbulent nineties in Sweden
4. Kharaj and land proprietary right in the sixteenth century: An example of law and economics
5. The name is absent
6. How Offshoring Can Affect the Industries’ Skill Composition
7. Parallel and overlapping Human Immunodeficiency Virus, Hepatitis B and C virus Infections among pregnant women in the Federal Capital Territory, Abuja, Nigeria
8. Giant intra-abdominal hydatid cysts with multivisceral locations
9. Forecasting Financial Crises and Contagion in Asia using Dynamic Factor Analysis
10. Income Growth and Mobility of Rural Households in Kenya: Role of Education and Historical Patterns in Poverty Reduction