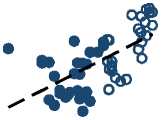
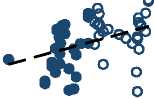
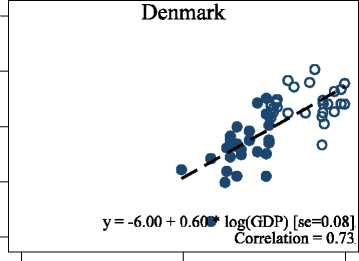
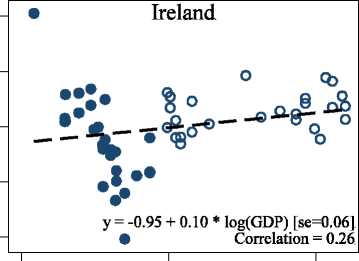
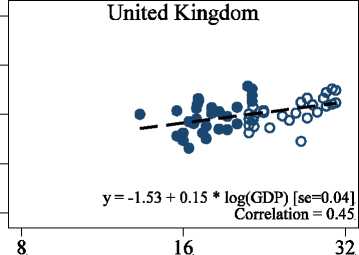
Figure 16. Change in Life Satisfaction and Economic Growth in Europe: Eurobarometer Survey
0.50-
Belgium
CD
OD
оЗ
(D
à
b
0.25-
0.00-
-0.25-
-0.50-
0.50-
France
cd
2
<υ
тЗ
й
• 1“
0.25-
0.00-
-0.25-
-0.50-
0.50-
0.25-
cd
и
o.oo-
-0.25-
-0.50-
у = -4.39 + 0.44 * Iog(GDP) [se=0.11]
Correlation = 0.63
Netherlands
у = -2.65 + 0.26 * Iog(GDP) [se=0.10]
Correlation = 0.41
16
32
Zv
Ч О О
« о
%
у = 3.51 + -0.35 * Iog(WDP) [se=0.18]
Correlation = -0.34
Greece
у = -1.48 + 0.15 * Iog(GDP) [se=0.12]
Correlation = 0.15
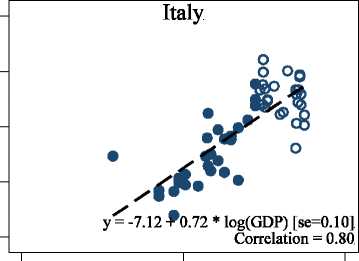
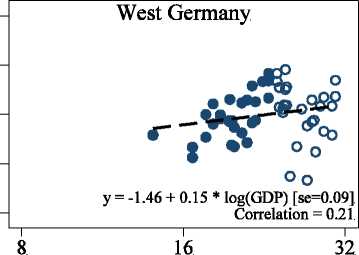
Real GDP per capita (thousands of dollars, log scale)
Sources: Eurobarometer Trendfile (for 1973-2002); biannual Eurobarometer reports (for 2002-07). Sources for GDP per capita are described in the text.
Notes: Solid circles represent separate observations from each round of the Eurobarometer survey from 1973 to 1989; these were the data analyzed in Easterlin (1995); open circles extend
the sample from 1990 to 2007. Each panel shows data for one of the nine countries analyzed in Easterlin (1995). Data are aggregated into a satisfaction index by running an ordered probit
regression of satisfaction on country × wave fixed effects and subtracting country averages. Dashed lines are fitted from the reported OLS regression; Newey-West standard errors (se) are
reported, accounting for first-order autocorrelation. The life satisfaction question asks, “On the whole, are you very satisfied, fairly satisfied, not very satisfied, or not at all satisfied with the
life you lead?” GDP per capita is at purchasing power parity in constant 2000 international dollars.
Figures—16
More intriguing information
1. The name is absent2. Rural-Urban Economic Disparities among China’s Elderly
3. New issues in Indian macro policy.
4. The name is absent
5. The name is absent
6. ENERGY-RELATED INPUT DEMAND BY CROP PRODUCERS
7. Does South Africa Have the Potential and Capacity to Grow at 7 Per Cent?: A Labour Market Perspective
8. EXPANDING HIGHER EDUCATION IN THE U.K: FROM ‘SYSTEM SLOWDOWN’ TO ‘SYSTEM ACCELERATION’
9. Linkages between research, scholarship and teaching in universities in China
10. The name is absent