Figure 14. Subjective Well-Being-Income Gradients across Time: World Values Survey
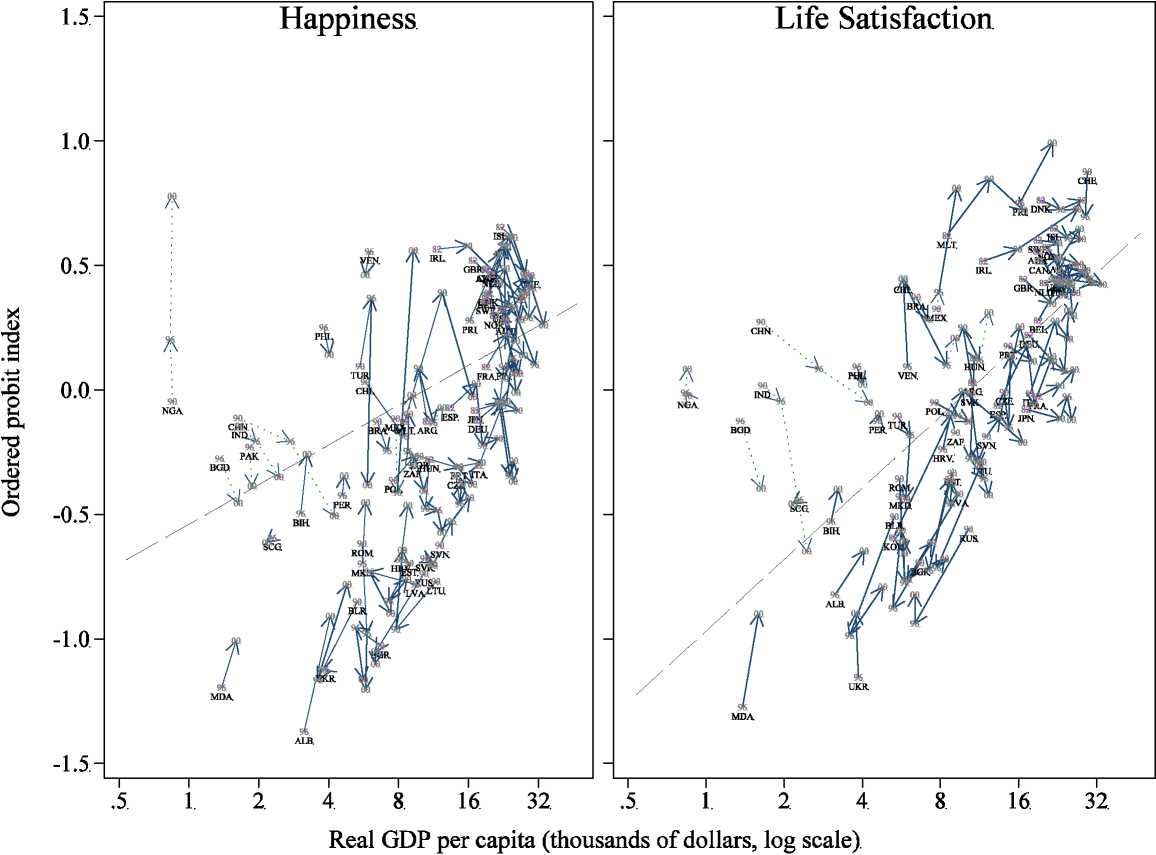
Source: World Values Survey, waves 1-4. Sources for GDP per capita are described in the text.
Notes: Arrows show the evolution of measured well-being and real GDP for each country. Dotted arrows join observations based on noncomparable sampling frames (see appendix B).
Dashed line is fitted from an OLS regression of the well-being measure on the natural log of real GDP, estimated from pooling all four waves. See notes to figure 3 for question details and
construction of aggregate well-being indices. Real GDP is at purchasing power parity in constant 2000 international dollars.
Figures—14
More intriguing information
1. Linkages between research, scholarship and teaching in universities in China2. Non Linear Contracting and Endogenous Buyer Power between Manufacturers and Retailers: Empirical Evidence on Food Retailing in France
3. The name is absent
4. Centre for Longitudinal Studies
5. Demographic Features, Beliefs And Socio-Psychological Impact Of Acne Vulgaris Among Its Sufferers In Two Towns In Nigeria
6. sycnoιogιcaι spaces
7. Governance Control Mechanisms in Portuguese Agricultural Credit Cooperatives
8. The name is absent
9. Factores de alteração da composição da Despesa Pública: o caso norte-americano
10. Improving Business Cycle Forecasts’ Accuracy - What Can We Learn from Past Errors?