Figure 12. Within-Country and Between-Country Estimates of the Life Satisfaction-Income Gradient: 1999-2004 WVS
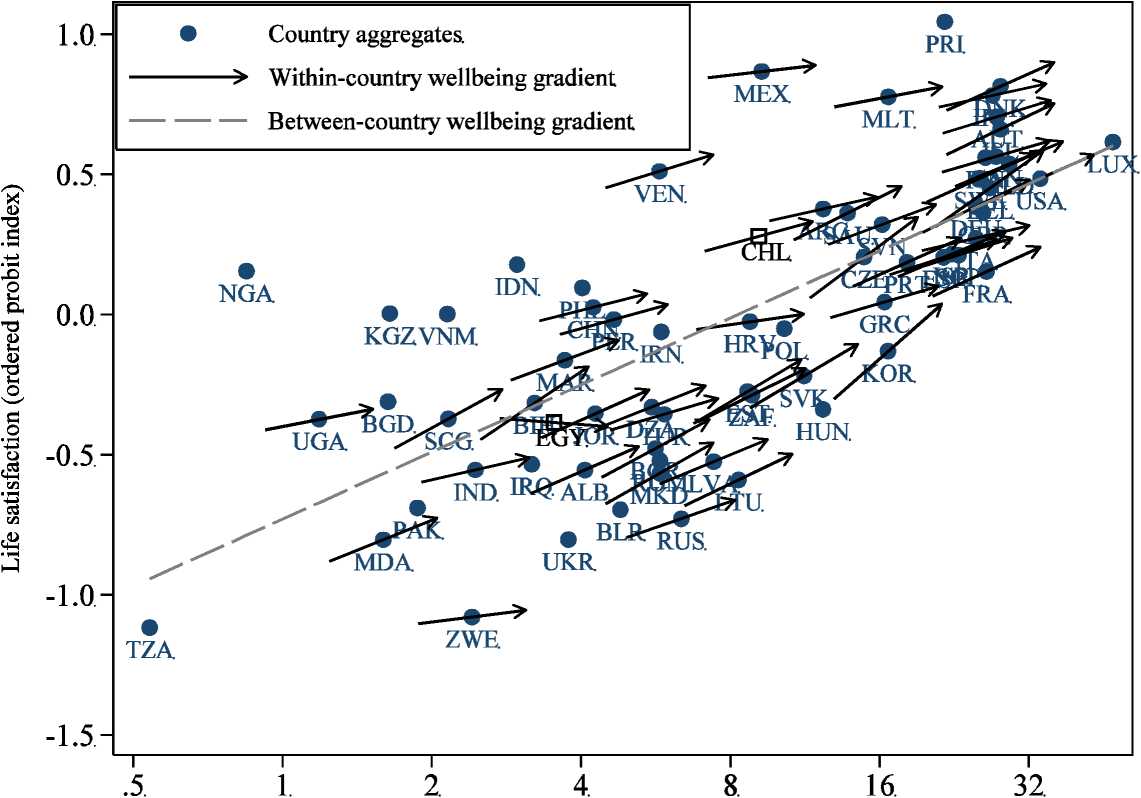
Real GDP per capita (thousands of dollars, log scale).
Source: World Values Survey, 1999-2004 wave. Sources for GDP per capita are described in the text.
Notes: Each round dot plots life satisfaction against GDP per capita for one of sixty-nine developed and developing countries; hollow squares denote samples that are not nationally
representative. The slope of the arrow represents the satisfaction-income gradient estimated for that country from a country-specific ordered probit regression of satisfaction on the log of
household income, controlling for gender, a quartic in age, and their interaction, as well as indicator variables for missing age or gender. Usable household income data were unavailable for
eighteen countries. The dashed line represents the between-country satisfaction-income gradient estimated from an OLS regression of the satisfaction index on the logarithm of real GDP per
capita. GDP per capita is at purchasing power parity in constant 2000 international dollars.
Figures—12
More intriguing information
1. The name is absent2. Ruptures in the probability scale. Calculation of ruptures’ values
3. An institutional analysis of sasi laut in Maluku, Indonesia
4. What Contribution Can Residential Field Courses Make to the Education of 11-14 Year-olds?
5. The name is absent
6. IMPLICATIONS OF CHANGING AID PROGRAMS TO U.S. AGRICULTURE
7. The name is absent
8. Food Prices and Overweight Patterns in Italy
9. Confusion and Reinforcement Learning in Experimental Public Goods Games
10. Wirkung einer Feiertagsbereinigung des Länderfinanzausgleichs: eine empirische Analyse des deutschen Finanzausgleichs