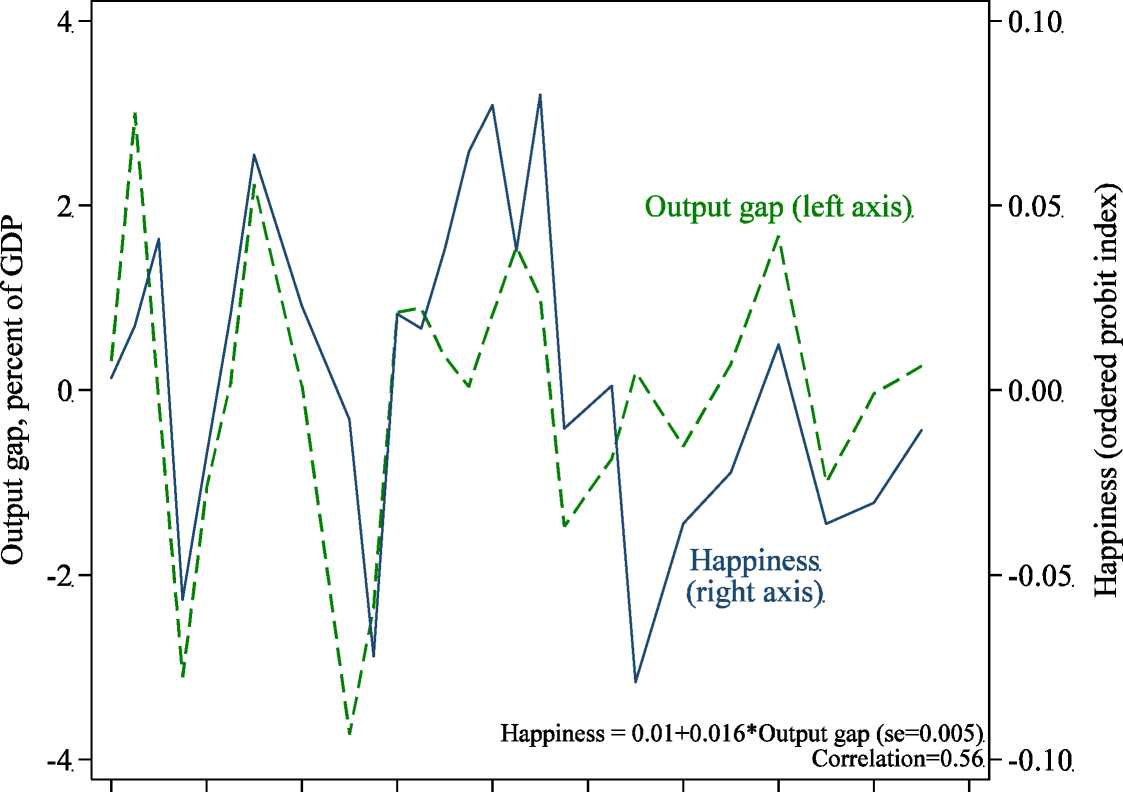
Figure 13. Happiness and the Output Gap in the United States
1972. 1976 1980. 1984 1988. 1992. 1996 2000. 2004 2008.
Sources: General Social Survey, 1972-2006; Bureau of Economic Analysis.
Notes: “Output gap” is the difference between real GDP per capita and its trend, estimated using a Hodrick-Prescott filter on annual data on the logarithm of real GDP per capita, with the
smoothing parameter set to 6.25. Happiness data are aggregated into a happiness index by running an ordered probit regression of happiness on year fixed effects. See figure 8 for wording
of the question. See text for details of the sample.
Figures—13
More intriguing information
1. The name is absent2. The name is absent
3. Licensing Schemes in Endogenous Entry
4. Fiscal federalism and Fiscal Autonomy: Lessons for the UK from other Industrialised Countries
5. The name is absent
6. The name is absent
7. The name is absent
8. HACCP AND MEAT AND POULTRY INSPECTION
9. Creating a 2000 IES-LFS Database in Stata
10. Towards Learning Affective Body Gesture