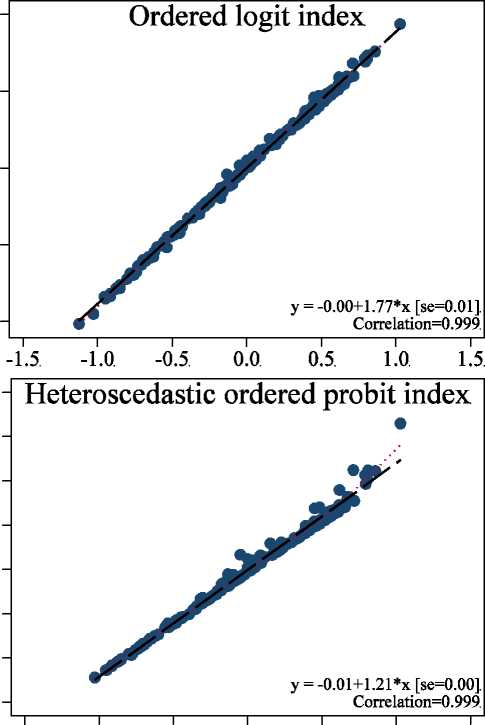
Figure A4. Alternative Estimates of Average Happiness: World Values Survey

100-
Percent quite or very happy
80.-
60-
40-

20-
Q-
y = 79.45+28.42*x [se=0.89]
Correlation=0.921.
2.
1.
0.
-1
-2.
2.0.
1.5
1.0.
0.5
0.0.
-0.5.
-1.0.
-1.5
-1.5. -1.0. -0.5 0.0.
0.5.
1.0 1.5
-1.5. -1.0. -0.5. 0.0, 0.5 1.0. 1.5.
Happiness: ordered probit index
Sources: World Values Surveys, 1981-2004.
Notes: Each point shows the estimated average level of happiness in one country, comparing one of four alternative metrics on the
vertical axis with the ordered probit index on the horizontal index. Dashed lines are fitted from the reported OLS regression;
dotted lines are fitted from lowess estimation.
Figures—27
More intriguing information
1. BARRIERS TO EFFICIENCY AND THE PRIVATIZATION OF TOWNSHIP-VILLAGE ENTERPRISES2. Who is missing from higher education?
3. Lending to Agribusinesses in Zambia
4. The storage and use of newborn babies’ blood spot cards: a public consultation
5. The name is absent
6. AGRICULTURAL TRADE IN THE URUGUAY ROUND: INTO FINAL BATTLE
7. The Variable-Rate Decision for Multiple Inputs with Multiple Management Zones
8. LIMITS OF PUBLIC POLICY EDUCATION
9. Spectral calibration of exponential Lévy Models [1]
10. Gianluigi Zenti, President, Academia Barilla SpA - The Changing Consumer: Demanding but Predictable