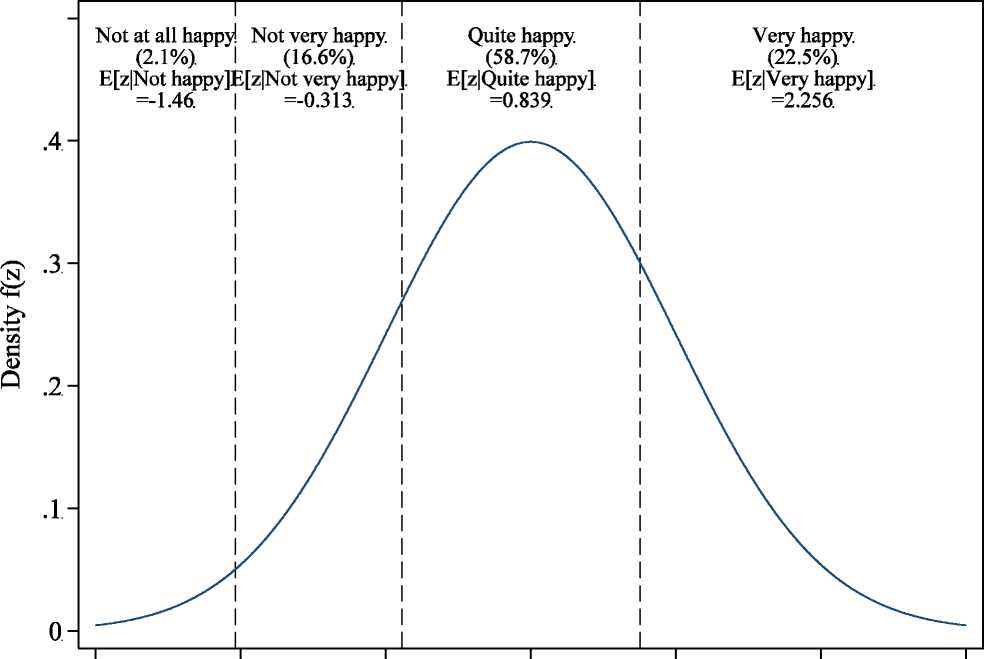
Figure A1. Fitting an Ordered Probit
-3 -2 -1 О 1 2 3
Subjective well-being, z~N(0,l)
Source: World Values Survey, 1981-2004.
Notes: Happiness question asks, “Taking all things together, would you say you are: ‘very happy,’ ‘quite happy,’ ‘not very
happy,’ [or] ‘not at all happy?’” Figure shows the assumed normal distribution of a latent happiness variable when running an
ordered probit regression; by a standard normalization, this distribution has a mean of zero and a standard deviation of one.
Dashed lines represent the cutpoints estimated from running an ordered probit regression of happiness on country × wave fixed
effects. Thus the country × wave fixed effects are equivalent to scoring “not at all happy” as -1.460, “not very happy” as -0.313,
“quite happy” as 0.839, and “very happy” as 2.256.
Figures—24
More intriguing information
1. Effects of a Sport Education Intervention on Students’ Motivational Responses in Physical Education2. Educational Inequalities Among School Leavers in Ireland 1979-1994
3. Evolutionary Clustering in Indonesian Ethnic Textile Motifs
4. Notes on an Endogenous Growth Model with two Capital Stocks II: The Stochastic Case
5. Graphical Data Representation in Bankruptcy Analysis
6. The name is absent
7. The name is absent
8. Does Market Concentration Promote or Reduce New Product Introductions? Evidence from US Food Industry
9. Spatial agglomeration and business groups: new evidence from Italian industrial districts
10. Licensing Schemes in Endogenous Entry