|
Reaction of M |
Reaction of IN |
Reaction of A |
Reaction of T |
Reaction of TR |
Reaction of S |
|
to a shock in EC |
to a shock in EC |
to a shock in EC |
to a shock in EC |
to a shock in EC |
to a shock in EC |
Figure 6: Impulse Responses for Sectoral Output and Equity Capital with Cholesky Decomposition
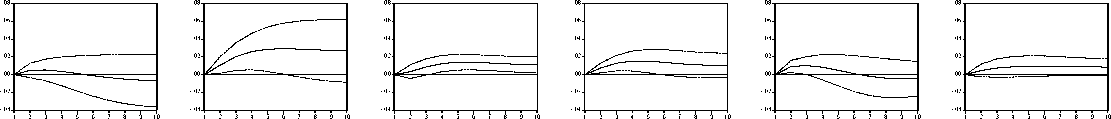
Note: The solid lines trace the impulse responses of the sectoral output of mining (M), industry (IN), agriculture (A), trade (T), trans-
portation (TR) and services (S) to a shock in equity capital (EC) for the years 1870 to 1912.
4 A sectoral analysis
Table I: Variance Decomposition for Sectoral Output and Equity Capital
|
Period |
M due to EC |
IN due to EC |
A due to EC |
T due to EC |
TR due to EC |
S due to EC |
|
^^5 |
0.670 |
20.532 |
16.207 |
23.426 |
3.594 |
5.202 |
|
[3.026] |
[13.086] |
[9.637] |
[15.464] |
[5.668] |
[7.061] | |
|
10 |
0.852 |
24.775 |
26.664 |
20.462 |
2.272 |
11.091 |
|
[6.767] |
[20.563] |
[13.019] |
[17.772] |
[5.561] |
[10.762] |
Note: The variance decomposition (in percent) is shown for the sectoral output of mining (M), industry
(IN), agriculture (A), trade (T), transportation (TR) and services (S). The figures show the share of the
forecast error variance that is due to a shock in equity capital.
More intriguing information
1. The quick and the dead: when reaction beats intention2. The name is absent
3. MANAGEMENT PRACTICES ON VIRGINIA DAIRY FARMS
4. The Evolution
5. The Challenge of Urban Regeneration in Deprived European Neighbourhoods - a Partnership Approach
6. The name is absent
7. Protocol for Past BP: a randomised controlled trial of different blood pressure targets for people with a history of stroke of transient ischaemic attack (TIA) in primary care
8. PROJECTED COSTS FOR SELECTED LOUISIANA VEGETABLE CROPS - 1997 SEASON
9. The name is absent
10. Herman Melville and the Problem of Evil