Figure 5: Impulse Responses for Sectoral Output and Total Assets
Reaction of M Reaction of IN Reaction of A Reaction of T Reaction of TR Reaction of S
to a shock in TA to a shock in TA to a shock in TA to a shock in TA to a shock in TA to a shock in TA
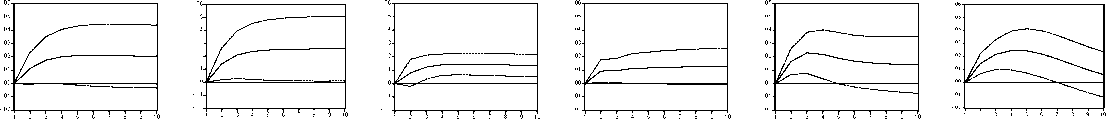
Note: The solid lines trace the impulse responses of the sectoral output of mining (M), industry (IN), agriculture (A), trade (T), trans-
portation (TR) and services (S) to a shock in total assets (TA) for the years 1870 to 1912.
4 A sectoral analysis
Table 6: Variance Decomposition for Sectoral Output and Total Assets
|
Period |
M due to TA |
IN due to TA |
A due to TA |
T due to TA |
TR due to TA |
S due to TA |
|
^^5 |
15.477 |
16.891 |
29.144 |
10.645 |
23.686 |
39.361 |
|
[13.614] |
[13.154] |
[12.461] |
[8.503] |
[14.269] |
[13.268] | |
|
10 |
20.735 |
23.690 |
47.979 |
14.297 |
17.487 |
48.659 |
|
[18.654] |
[19.408] |
[14.049] |
[11.824] |
[15.230] |
[14.824] |
Note: The variance decomposition (in percent) is shown for the sectoral output of mining (M), industry
(IN), agriculture (A), trade (T), transportation (TR) and services (S). The figures show the share of the
forecast error variance that is due to a shock in total assets.
More intriguing information
1. Searching Threshold Inflation for India2. MANAGEMENT PRACTICES ON VIRGINIA DAIRY FARMS
3. The name is absent
4. The name is absent
5. AGRIBUSINESS EXECUTIVE EDUCATION AND KNOWLEDGE EXCHANGE: NEW MECHANISMS OF KNOWLEDGE MANAGEMENT INVOLVING THE UNIVERSITY, PRIVATE FIRM STAKEHOLDERS AND PUBLIC SECTOR
6. The name is absent
7. Reputations, Market Structure, and the Choice of Quality Assurance Systems in the Food Industry
8. The name is absent
9. Financial Development and Sectoral Output Growth in 19th Century Germany
10. Second Order Filter Distribution Approximations for Financial Time Series with Extreme Outlier