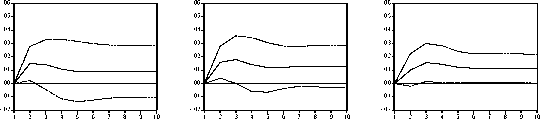
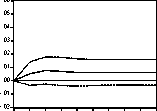
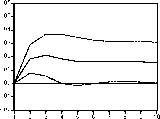
Figure f' Impulse Responses for Sectoral Output and Bank Lending
Reaction of M Reaction of IN Reaction of A
to a shock in B to a shock in B to a shock in B
Reaction of T
to a shock in B
Reaction of TR
to a shock in B
Reaction of S
to a shock in B

123456789 10
Note: The solid lines trace the impulse responses of the sectoral output of mining (M), industry (IN), agriculture (A), trade (T), trans-
portation (TR) and services (S) to a shock in bank lending (B) for the years 1870 to 1912.
4 A sectoral analysis
Table 5: Variance Decomposition for Sectoral Output and Bank Lending
|
Period |
M due to B |
IN due to B |
A due to B |
T due to B |
TR due to B |
S due to B |
|
~~5 |
6.773 |
9.691 |
16.049 |
4.556 |
24.643 |
16.559 |
|
[8.496] |
[8.481] |
[13.064] |
[6.939] |
[12.972] |
[14.152] | |
|
10 |
5.730 |
9.343 |
17.969 |
4.916 |
25.386 |
25.095 |
|
[9.577] |
[9.213] |
[14.958] |
[8.264] |
[15.532] |
[20.331] |
Note: The variance decomposition (in percent) is shown for the sectoral output of mining (M),
industry (IN), agriculture (A), trade (T), transportation (TR) and services (S). The figures show the
share of the forecast error variance that is due to a shock in bank lending.
More intriguing information
1. The Impact of Financial Openness on Economic Integration: Evidence from the Europe and the Cis2. Delivering job search services in rural labour markets: the role of ICT
3. On the Desirability of Taxing Charitable Contributions
4. Innovation and business performance - a provisional multi-regional analysis
5. AMINO ACIDS SEQUENCE ANALYSIS ON COLLAGEN
6. Luce Irigaray and divine matter
7. The name is absent
8. Are Japanese bureaucrats politically stronger than farmers?: The political economy of Japan's rice set-aside program
9. A methodological approach in order to support decision-makers when defining Mobility and Transportation Politics
10. Globalization and the benefits of trade