2 Description of the data and preliminary analysis
Transportation was the fastest growing among all sectors.
Figure 1: Sectoral Output Growth
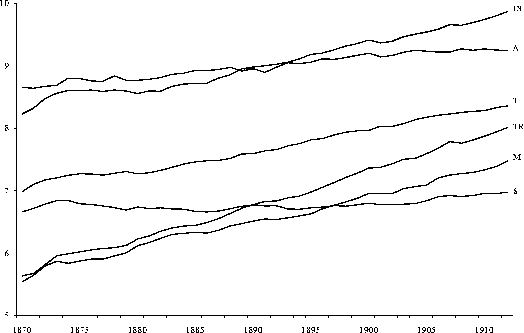
Note: The graphs for the sectoral output of mining (M), industry
(IN), agriculture (A), trade (T), transportation (TR), and services
(S) are displayed.
Table 1: Results of the ADF tests
|
Variable |
Levels |
1st Differences | ||||
|
ADF |
k |
Prob. |
ADF |
k |
Prob. | |
|
Net Domestic Product |
0.252 |
0 |
0.973 |
-5.493*** |
0 |
0.000 |
|
Investment |
-0.988 |
1 |
0.749 |
-12.507*** |
0 |
0.000 |
|
Bank Lending |
-2.455 |
0 |
0.134 |
-6.950*** |
1 |
0.000 |
|
Total Assets |
-1.921 |
1 |
0.320 |
-3.941*** |
0 |
0.004 |
|
Equity Capital |
0.123 |
4 |
0.963 |
-4.938*** |
3 |
0.000 |
|
Mining |
-0.205 |
0 |
0.930 |
-5.679*** |
1 |
0.000 |
|
Industry |
0.119 |
0 |
0.964 |
-4.875*** |
0 |
0.000 |
|
Agriculture |
-0.953 |
0 |
0.761 |
-8.067*** |
0 |
0.000 |
|
Trade |
0.347 |
0 |
0.978 |
-7.984*** |
0 |
0.000 |
|
Transportation |
-0.584 |
0 |
0.864 |
-5.465*** |
0 |
0.000 |
|
Services |
-1.364 |
1 |
0.591 |
-4.804*** |
0 |
0.000 |
Note: The ADF test is calculated for levels and first differences for the vari-
ables net domestic product, investment, bank lending, total assets, equity
capital, mining, industry, agriculture, trade, transportation and services for
the years 1870 to 1912. The lag length is selected by the Schwarz infor-
mation criterion. *** (**,*) indicates significance at the 99% (95%, 90%)
level.
We also take an alternative measure of the banks’ contribution to financing investment.
Our indicator Total Assets (TA) includes the total assets of savings banks, cooperate credit
associations, mortgage banks, banks of issue and commercial banks.10 All data are recorded
on an annual basis. The sample period covers the years 1870 to 1912.11
10See Hoffmann(1965), tables 202, 203, 205, 206, 207, p.733ff.
11Note that some of the data go back to 1850. In our benchmark regressions, we did not take the full time
period, however, to limit our analysis to a period with a uniform federal territory of Germany and to avoid
structural breaks. We also avoid the necessary interpolation of some data points in the 1850s. The main
results of the analysis are unaffected by the choice of the time window.
More intriguing information
1. The name is absent2. The name is absent
3. The name is absent
4. PACKAGING: A KEY ELEMENT IN ADDED VALUE
5. Kharaj and land proprietary right in the sixteenth century: An example of law and economics
6. ROBUST CLASSIFICATION WITH CONTEXT-SENSITIVE FEATURES
7. I nnovative Surgical Technique in the Management of Vallecular Cyst
8. IMPACTS OF EPA DAIRY WASTE REGULATIONS ON FARM PROFITABILITY
9. Bird’s Eye View to Indonesian Mass Conflict Revisiting the Fact of Self-Organized Criticality
10. National urban policy responses in the European Union: Towards a European urban policy?