wage income.
Table 1. Parameter values, tax rates and factor prices in the initial steady
state equilibrium.
Parameter values:
ρ
σ
μ
α
η
δH
β
φ
h0
e
Time preference rate
Intertemporal elasticity of substitution
Coefficient in quadratic utility function
Weight parameter in quadratic utility function wrt. leisure
Elasticity of human capital wrt. time devoted to learning
Depreciation rate for human capital
Elasticity of labor services wrt. human capital
Value share of physical capital in production of goods
Depreciation rate for physical capital
Initial human capital stock
Endowment of time in each period
0.031
0.667
0.250
0.750
0.750
0.100
0.350
0.312
0.100
1.000
1.000
Tax rates:
τl Tax rate on labor income 0.375
Factor prices:
r Annual interest rate
w Wage rate before tax
0.050
1.600
We choose parameter values such that the average individual labor supply
profile resembles the estimated average individual labor supply profile (measured
in hours worked) for recent generations in McGratten and Rogerson (1998). Fig-
ure 1 illustrates the allocation of time over the life cycle for the representative
agent in the initial steady state. Human capital formation is highest at the be-
ginning of the life cycle, roughly constant between the age of 25 and 55, and then
phased out. Retirement starts at the age of 63, and time spent on leisure exceeds
time spent working around the age of 70.
Figure 1. Allocation of time over the life cycle
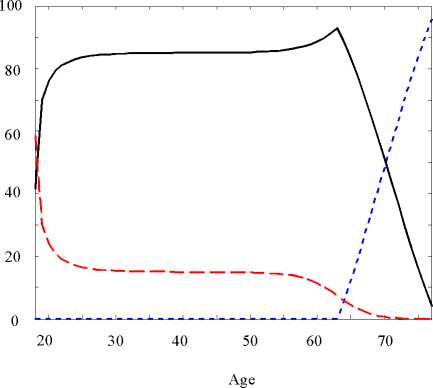
----- Work effort
--Training
---Retirement
10
More intriguing information
1. Self-Help Groups and Income Generation in the Informal Settlements of Nairobi2. IMPACTS OF EPA DAIRY WASTE REGULATIONS ON FARM PROFITABILITY
3. Income Mobility of Owners of Small Businesses when Boundaries between Occupations are Vague
4. The name is absent
5. The name is absent
6. References
7. Der Einfluß der Direktdemokratie auf die Sozialpolitik
8. On the Real Exchange Rate Effects of Higher Electricity Prices in South Africa
9. IMPROVING THE UNIVERSITY'S PERFORMANCE IN PUBLIC POLICY EDUCATION
10. The name is absent