61
Figure 1: Growth and natural resource dependence
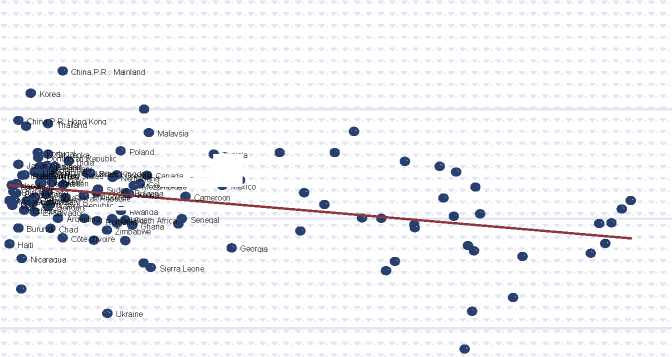
-Republic „ ,
Rwanda
Tunisia
Canada
⅛m⅛Ue MoroccoMexi
Fuels, ores and metals exports in percent of merchandise exports 1970-2002
Source: World Development Indicators, World Bank
Figure 2: Natural resource dependence reduces competitiveness
Relative
price of
non-
traded
goods
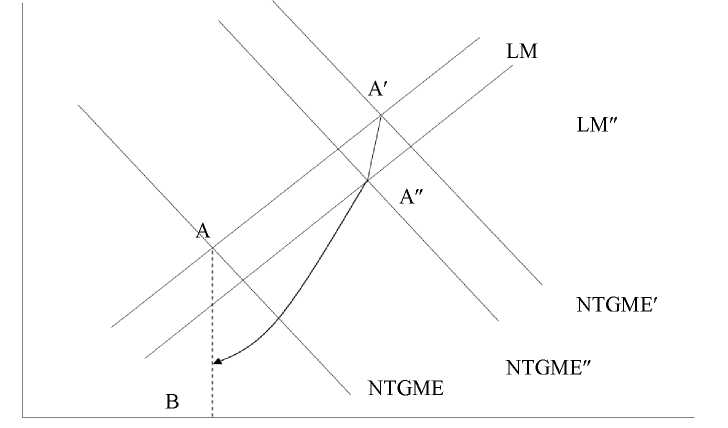
Fraction of labour in non-traded sector
Key: A resource boom shifts A to A, so a shift from the traded to non-traded sector and
real appreciation. With time relative productivity of the traded declines if the
elasticity of substitution in demand goods is less than unity. This shifts the
equilibrium from A to A' and eventually to B. In the long run there is real
depreciation and the allocation of labour is returned to its original level.
More intriguing information
1. Structural Breakpoints in Volatility in International Markets2. What Contribution Can Residential Field Courses Make to the Education of 11-14 Year-olds?
3. On the Desirability of Taxing Charitable Contributions
4. The name is absent
5. Should Local Public Employment Services be Merged with the Local Social Benefit Administrations?
6. Distribution of aggregate income in Portugal from 1995 to 2000 within a SAM (Social Accounting Matrix) framework. Modeling the household sector
7. DEVELOPING COLLABORATION IN RURAL POLICY: LESSONS FROM A STATE RURAL DEVELOPMENT COUNCIL
8. A parametric approach to the estimation of cointegration vectors in panel data
9. Palkkaneuvottelut ja työmarkkinat Pohjoismaissa ja Euroopassa
10. The name is absent