Figure 1: Expected utility as a function of the size of the co-paymant
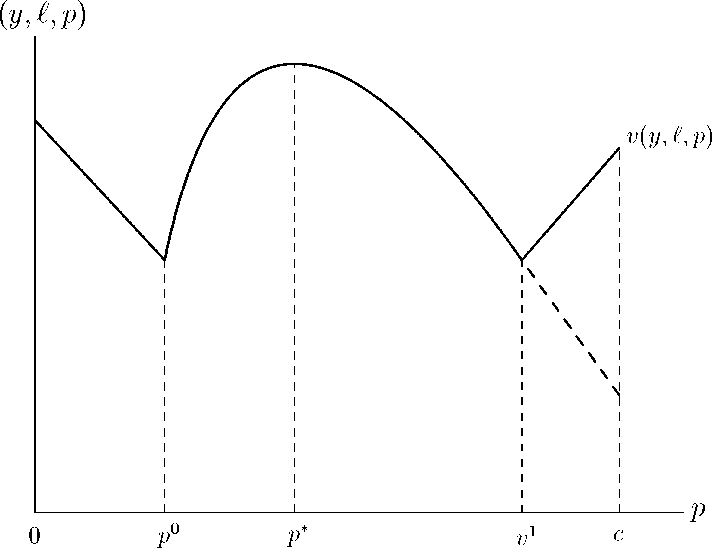
As p increases beyond p0, more and more persons choose not to be
treated. The person illustrated by Figure 1 chooses treatment provided the
co-payment does not exceed p1. For p > p1 expected utility is increasing in
p, cf. (7). In Figure 1, v is strictly concave for p ∈ (p0,p1). Generally, this
need not be the case. And even if V is strictly concave for p ∈ (p0,p1) with
a local maximum at p*, it is not obvious which of the three values V (y,£, 0),
V (y,£,p*) and V (y,£,c) is highest.
3 Co-payment and social welfare
The objective of the government is to maximize the sum of welfare for all
persons. However, for a government concerned about equity it is not reason-
able to assume that this sum is unweighted. If the government cares about
equity, it is reasonable to assume that persons with low expected utility have
a higher weight in the sum of welfare than persons with high expected util-
More intriguing information
1. Perceived Market Risks and Strategic Risk Management of Food Manufactures: Empirical Results from the German Brewing Industry2. Partner Selection Criteria in Strategic Alliances When to Ally with Weak Partners
3. The Triangular Relationship between the Commission, NRAs and National Courts Revisited
4. The name is absent
5. Who runs the IFIs?
6. The name is absent
7. The name is absent
8. The name is absent
9. Death as a Fateful Moment? The Reflexive Individual and Scottish Funeral Practices
10. Fiscal Rules, Fiscal Institutions, and Fiscal Performance