Uncertain Productivity Growth
5 COMPETITION & COMPARATIVE STATICS
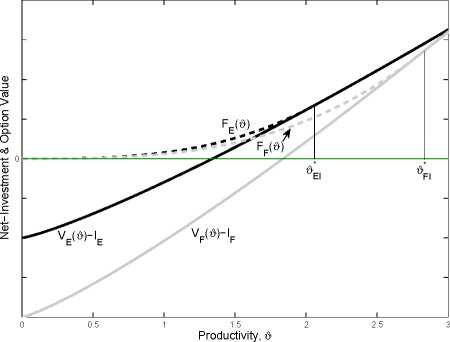
(a) Country A (Low Competition)
νA = 0.75
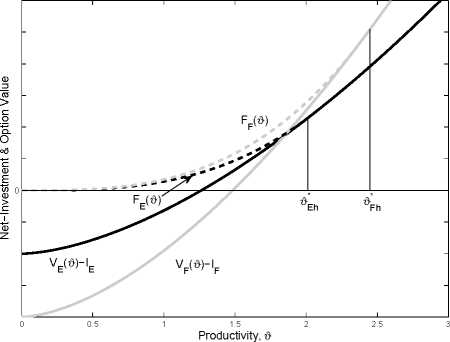
(b) Country B (High Competition)
νB = 0.9
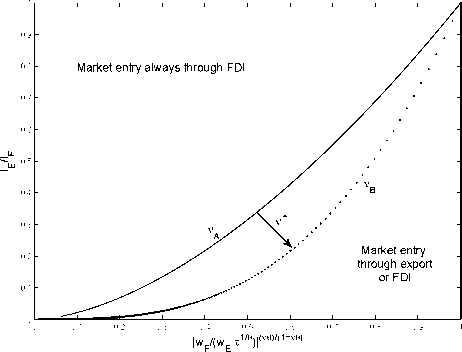
(c) Degree of Competition & Relative Cost Patterns
Figure 10: Competition Effects
Figure 10 depicts the export and FDI value functions in two different countries. The investor is
confronted with exactly the same cost patterns in both foreign markets.17 The only difference
appears in the degree of competition, with country A exhibiting a lower competition between
the differentiated goods Xi than country B (νA < νB). In the low competition case, the given
relative cost pattern leads to an export productivity cut-off tf*El which is lower than the FDI
cut-off. Simultaneously, given the degree of competition, the upper envelope function in panel
a) turns out to be dominated by the option and investment value function of the export mode.
Assuming that the initial productivity level $0 is below tf*El, the investor will definitely serve the
17In both markets the investor is confronted with the following cost structure: IE = 2, τ = 1.3, θ = 0.5, WWF = 1, r =
0.06, α = 0.02, σ = 0.01. F E
37
More intriguing information
1. HOW WILL PRODUCTION, MARKETING, AND CONSUMPTION BE COORDINATED? FROM A FARM ORGANIZATION VIEWPOINT2. The open method of co-ordination: Some remarks regarding old-age security within an enlarged European Union
3. The name is absent
4. ROBUST CLASSIFICATION WITH CONTEXT-SENSITIVE FEATURES
5. What Lessons for Economic Development Can We Draw from the Champagne Fairs?
6. Midwest prospects and the new economy
7. The name is absent
8. The East Asian banking sector—overweight?
9. Performance - Complexity Comparison of Receivers for a LTE MIMO–OFDM System
10. National curriculum assessment: how to make it better