|
Country 1, ∆ Unemployment 16"∣"" ■' ` '”■••: ■ 0.0 14- : i : 0.0 : : : 0.0 12- ∙ ; : : ' 0.0 10-.. "" .. : ':"-. : 0.0 8- " : : ■ : '■■-../ 0.0 6 — , " " " ’ ’ ∙ : 0.0 3.8 ʌ''-. .. - - " " 55∖ 0 >-< ∙ ' ` ∙ . —15 6.7 ∖. .∙∙^ ∙. . -' ^∖a, . 30 85 _ " 45 σ 10 60 τ (%) |
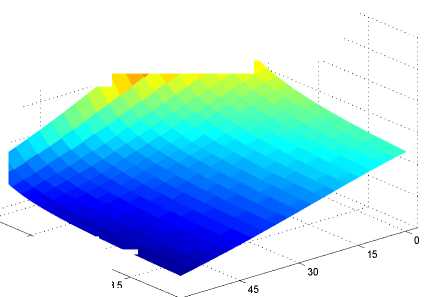
Country 2, ∆ Unemployment 7>"""' : ..∙"i"' . : : ' — ■... 6-. .-""" : ^'√--.,, : 5—'"" i ■'■■■-. 4-. .∙ "" : '""... ; 3- --""" a ; 2- : 1 -.^∙,."∙ ' . "Л "... : 3.8 ""..^ . .^-'---∙∙’Z 'jʃ^- 5∙5∖ ' ’ 0 ^>∙< ` ∙ 15 6'^^^^ 30 85 45 σ 10 60 τ (%) |
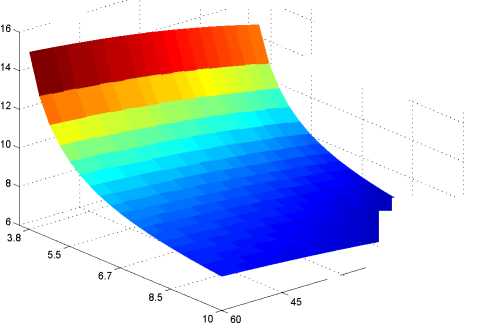
Figure 4: Change in unemployment [on the vertical axis] as a function of trade costs and
the elasticity of substitution for a given change of b1 from 0.4 to 0.8.
Forslid, Martin, Ottaviano, and Robert-Nicoud, 2003) emphasize the role of market size
for explaining the pattern of trade as well as the agglomeration of industries and activities.
Hence, we next investigate how changes in the degree of external economies of scale, ν ,
affect the spill-over. Result 4 summarizes our findings:
Result 4 [External economies of scale and spill-overs]
Stronger external economies of scale result in more pronounced unemployment effects in
all countries.
Figure 5 reveals that a higher ν implies a larger change in unemployment in all coun-
tries. The reason is that now the income effect is reinforced because the absolute size of
the countries matters while this effect is sterilized with ν = 0. A larger market implies
higher demand, leading to more production and, therefore, lower unemployment.
However, if unemployment benefits rise, the demand shrinks due to lower income
(resulting from less efficient institutions). A higher degree of external economies of scale
reinforces this process, leading in the end to higher unemployment in the country where
the unemployment benefits rise. The spill-overs for the trading partner are also larger
with a higher degree of external economies of scale due to the shrinking export market.
3.5 How important is firm-level heterogeneity?
Next, we explore the role of firm heterogeneity by changing γ , the shape parameter of
the Pareto distribution. We vary γ between 3.8 and 10. A shape parameter of the Pareto
distribution of γ = 3.8 with a lower bound of 7 = 0.5 implies a variance of 0.067, a
standard deviation of 0.260 and a coefficient of variation of 0.382, whereas a γ = 10
implies a variance of 0.004 a standard deviation of 0.062 and a coefficient of variation
25
More intriguing information
1. From Communication to Presence: Cognition, Emotions and Culture towards the Ultimate Communicative Experience. Festschrift in honor of Luigi Anolli2. The name is absent
3. The name is absent
4. Trade Liberalization, Firm Performance and Labour Market Outcomes in the Developing World: What Can We Learn from Micro-LevelData?
5. The urban sprawl dynamics: does a neural network understand the spatial logic better than a cellular automata?
6. Olfactory Neuroblastoma: Diagnostic Difficulty
7. Change in firm population and spatial variations: The case of Turkey
8. Biological Control of Giant Reed (Arundo donax): Economic Aspects
9. The name is absent
10. Education Responses to Climate Change and Quality: Two Parts of the Same Agenda?