Figure 3 is designed to be a descriptive summary of findings rather than an exact
portrayal of statistical relationships or causal paths. Some connections are likely to be
stronger than others, for example, because they are suggested by both quantitative and
qualitative analyses. This is not meant to be the ‘right‘ model but rather a best
description of relationships found in our study. It can be seen that as well as connections
already discussed, we have also added two areas suggested by our questionnaire and case
study data (see Blatchford, in press,a) but which need further verification: the depth of
curriculum coverage and the quality of student work.
Class size and pupil attainment
In this section selected results are highlighted. A full presentation and discussion can
be found in Blatchford, Bassett, Goldstein and Martin (submitted)
Statistical methods: The effect of class size upon progress in literacy and mathematics
was examined for each of the three years separately. The models controlled for the
pupils’ attainment scores in previous school years, so that the results more accurately
reflected the progress made during the course of the year. Adjustments were also
made for characteristics of the children, class and teacher and changes in class size
from previous years. The original scores were transformed to normal scores so that
one unit of the outcome represented one standard deviation of the original score. All
analyses used multilevel models (Goldstein, 1995), to take account of the structure of
the data, with pupils contained within classes, which were nested within schools.
Reception Year - Literacy
The results showed that the relationship between class size and reception year
progress in literacy varied for pupils of differing baseline attainment, and so these are
presented separately in Figure 4.
Figure 4: Relationship between Reception year class size and literacy progress
(adjusted for school entry scores).
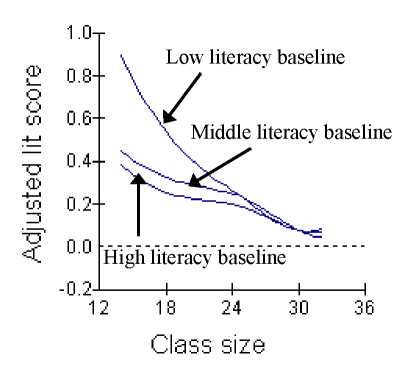
Pupils were split into three ability groups, based on their pre-reception year literacy
scores (bottom 25%, middle 50% and top 25%). There was a strong and statistically
16
More intriguing information
1. Human Rights Violations by the Executive: Complicity of the Judiciary in Cameroon?2. Short report "About a rare cause of primary hyperparathyroidism"
3. The Effects of Attendance on Academic Performance: Panel Data Evidence for Introductory Microeconomics
4. A Dynamic Model of Conflict and Cooperation
5. Moi individuel et moi cosmique Dans la pensee de Romain Rolland
6. The Role of Land Retirement Programs for Management of Water Resources
7. European Integration: Some stylised facts
8. The name is absent
9. School Effectiveness in Developing Countries - A Summary of the Research Evidence
10. Eigentumsrechtliche Dezentralisierung und institutioneller Wettbewerb