significant increase in attainment for all three groups, though there was a larger effect
for pupils with lower baseline attainment. A reduction in class size from 30 to 20
pupils resulted in an increase in attainment of approximately 0.35 standard deviations
for the low attainers, 0.2 standard deviations for the middle attainers, and 0.15
standard deviations for the high attainers.
Reception year - Mathematics
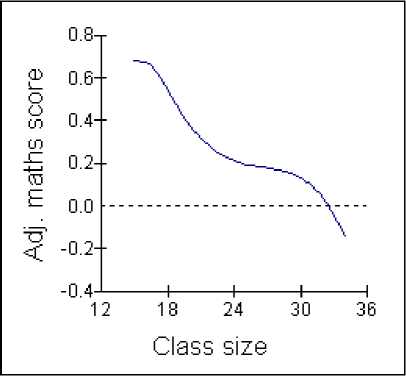
In contrast to literacy attainment, there was no evidence that the effects of class size
varied between the three different baseline attainment groups. The relationship
between class size and mathematics progress is shown in Figure 5. There is a roughly
linear (straight line) relationship between the two variables, which was found to be
highly statistically significant (p<0.001). A reduction in class size from 30 to 20
pupils resulted in an increase in attainment of approximately 0.25 standard deviations.
Figure 5: Relationship between class size and mathematics attainment in Reception
(adjusted for school entry scores).
Year 1 & Year 2 - Literacy & Mathematics
The results of the Year 1 and Year 2 data indicated that class size in each year was not
found to be related to progress in either literacy or mathematics.
The effect of reception year class size on Year 1 results - Literacy
We examined whether the benefits gained by small classes in the Reception year were
sustained during Year 1. In these analyses, Year 1 literacy scores were used as the
outcome variable, and Reception year class size was used as the main explanatory
variable. The end of reception scores were included, so that the progress of pupils
over Year 1 was examined. The majority of pupils moved to similar sized classes, but
there were some who moved to either smaller or larger classes. In order to see
whether change in class size was important, pupils were split into three groups: first,
the 25% of pupils who had the biggest change to smaller classes, second, the middle
50% who moved to similar sized classes, and third, the 25% of pupils who had the
biggest change to larger classes. Results showed that there was a significant
interaction between class size and change in class size group (p=0.003), indicating
17
More intriguing information
1. Financial Development and Sectoral Output Growth in 19th Century Germany2. Bridging Micro- and Macro-Analyses of the EU Sugar Program: Methods and Insights
3. Moi individuel et moi cosmique Dans la pensee de Romain Rolland
4. Portuguese Women in Science and Technology (S&T): Some Gender Features Behind MSc. and PhD. Achievement
5. Putting Globalization and Concentration in the Agri-food Sector into Context
6. Philosophical Perspectives on Trustworthiness and Open-mindedness as Professional Virtues for the Practice of Nursing: Implications for he Moral Education of Nurses
7. Strategic Planning on the Local Level As a Factor of Rural Development in the Republic of Serbia
8. Benchmarking Regional Innovation: A Comparison of Bavaria, Northern Ireland and the Republic of Ireland
9. Credit Markets and the Propagation of Monetary Policy Shocks
10. The name is absent