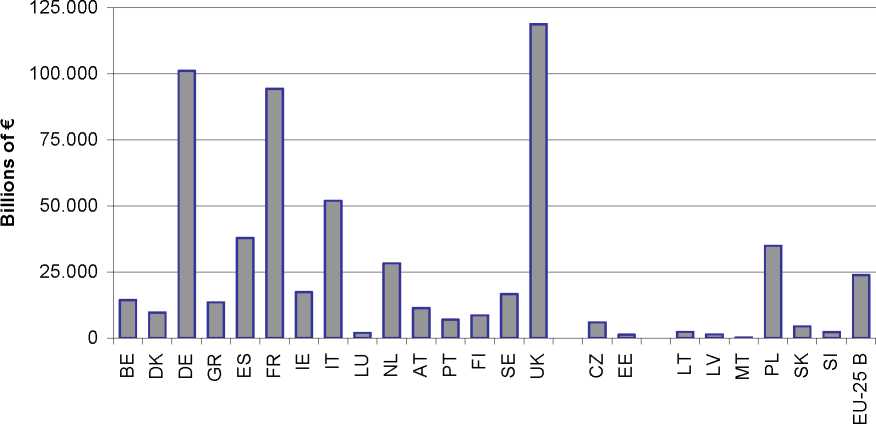
Figure 3.8 Present Value of GDP through 2051 (billions of inflation adjusted €)
|
PV_GDP (€ billions)________ |
PV_GDP |
PV_GDP | |||
|
Belgium |
14,435 |
Netherlands |
28,326 |
Hungary | |
|
Denmark |
9,653 |
Austria |
11,401 |
Lithuania |
2,375 |
|
Germany |
101,130 |
Portugal |
6,985 |
Latvia |
1,387 |
|
Greece |
13,530 |
Finland |
8,580 |
Malta |
146 |
|
Spain |
37,851 |
Sweden |
16,682 |
Poland |
34,970 |
|
France |
94,327 |
UK |
118,870 |
Slovakia |
4,470 |
|
Ireland |
17,435 |
Cyprus |
Slovenia |
2,271 | |
|
Italy |
51,949 |
Czech Rep. |
5,987 |
EU bench’k |
23,891 |
|
Luxembourg |
1,982__________ |
_______Estonia |
1,292__________ | ||
94
More intriguing information
1. The name is absent2. A Rational Analysis of Alternating Search and Reflection Strategies in Problem Solving
3. The migration of unskilled youth: Is there any wage gain?
4. The Provisions on Geographical Indications in the TRIPS Agreement
5. Psychological Aspects of Market Crashes
6. The name is absent
7. Can genetic algorithms explain experimental anomalies? An application to common property resources
8. THE EFFECT OF MARKETING COOPERATIVES ON COST-REDUCING PROCESS INNOVATION ACTIVITY
9. The name is absent
10. The name is absent