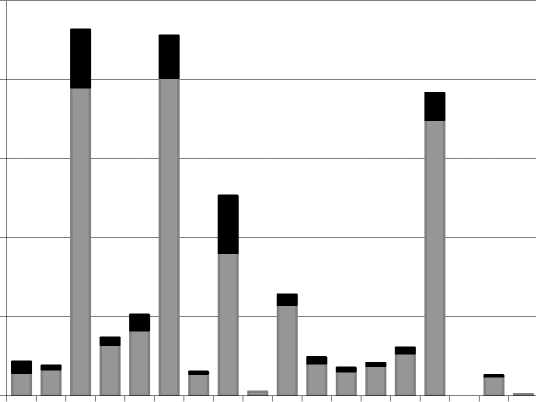
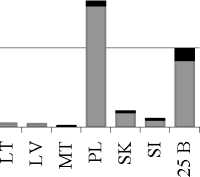
Figure 3.4 Fiscal Imbalances of EU Countries (billions of €)
10.000
8.000
4P
ч—
О
СЛ
C
о
I
6.000
4.000
2.000
0
□ FI-DEBT HDEBT
|
Total FI |
Debt |
FI-Debt |
_____________Total FI |
Debt |
FI-Debt | ||
|
Belgium |
854 |
273 |
581 |
Sweden |
1,215 |
144 |
1071 |
|
Denmark |
754 |
84 |
670 |
UK |
7,666 |
685 |
6981 |
|
Germany |
9,263 |
1451 |
7812 |
Cyprus | |||
|
Greece |
1,470 |
183 |
1288 |
Czech Rep. |
514 |
28 |
486 |
|
Spain |
2,045 |
389 |
1656 |
Estonia |
41 |
1 |
41 |
|
France |
9,111 |
1069 |
8042 |
Hungary | |||
|
Ireland |
600 |
44 |
556 |
Lithuania |
90 |
4 |
86 |
|
Italy |
5,054 |
1442 |
3612 |
Latvia |
68 |
2 |
67 |
|
Luxembourg |
102 |
2 |
100 |
Malta |
19 |
3 |
16 |
|
Netherlands |
2,556 |
257 |
2299 |
Poland |
3,163 |
95 |
3068 |
|
Austria |
967 |
151 |
817 |
Slovakia |
391 |
15 |
376 |
|
Portugal |
703 |
84 |
620 |
Slovenia |
197 |
8 |
190 |
|
Finland |
820 |
67 |
752 |
EU |
1,971 |
282 |
1690 |
Source: Author’s calculations.
91
More intriguing information
1. Notes on an Endogenous Growth Model with two Capital Stocks II: The Stochastic Case2. Fiscal Policy Rules in Practice
3. Mergers and the changing landscape of commercial banking (Part II)
4. NATIONAL PERSPECTIVE
5. The name is absent
6. Should Local Public Employment Services be Merged with the Local Social Benefit Administrations?
7. Nach der Einführung von Arbeitslosengeld II: deutlich mehr Verlierer als Gewinner unter den Hilfeempfängern
8. How we might be able to understand the brain
9. An Investigation of transience upon mothers of primary-aged children and their school
10. Direct observations of the kinetics of migrating T-cells suggest active retention by endothelial cells with continual bidirectional migration