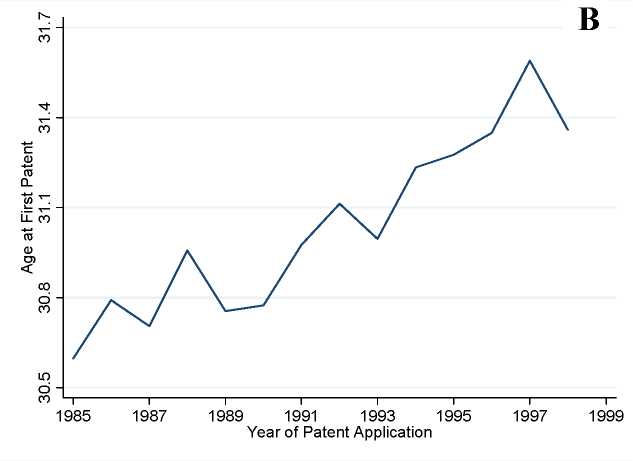
Figure 2: The Decline of Innovation in the Early Life Cycle
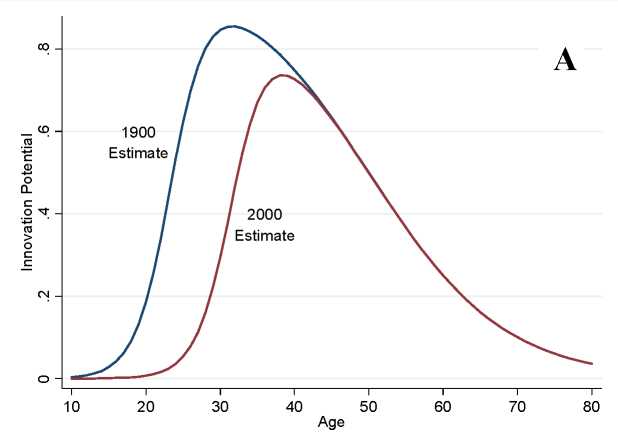
Notes: Fig. 2A presents an individual’s potential to produce great achievements as a function of age, comparing
estimates for the year 1900 with the year 2000. The estimates come from analyzing the full set of Nobel Prize
winners and great technological inventors over the 20th Century (source: Jones 2010). Fig. 2B presents trends in the
age at first patent, showing the advance in age at the start of the innovative career, using data on U.S. patent holders
(source: Jones 2009). See further discussion in text.
These estimates, showing a substantial, increasing delay in great achievements, closely
match the trend in age at first patent among more ordinary inventors. Age at first patent is a
more direct measure of early life cycle innovative productivity. The raw trend, analyzed in
More intriguing information
1. The name is absent2. PER UNIT COSTS TO OWN AND OPERATE FARM MACHINERY
3. Innovation in commercialization of pelagic fish: the example of "Srdela Snack" Franchise
4. Elicited bid functions in (a)symmetric first-price auctions
5. The name is absent
6. ISSUES IN NONMARKET VALUATION AND POLICY APPLICATION: A RETROSPECTIVE GLANCE
7. Fiscal Rules, Fiscal Institutions, and Fiscal Performance
8. Globalization, Divergence and Stagnation
9. Heterogeneity of Investors and Asset Pricing in a Risk-Value World
10. The name is absent