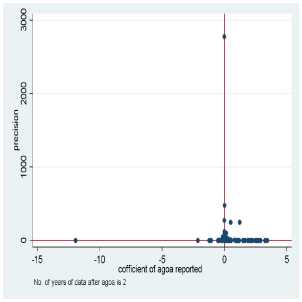
(a) 2 or more years after agoa
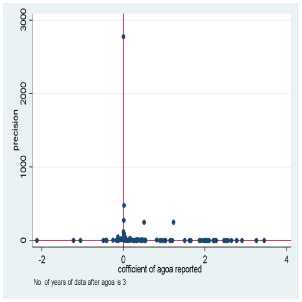
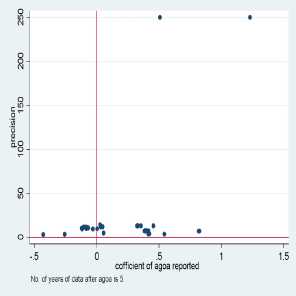
(b) 3 or more years after agoa
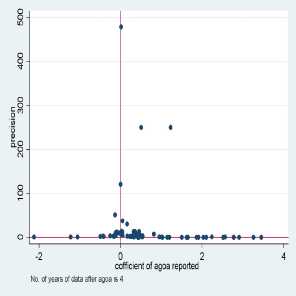
(c) 4 or more years after agoa
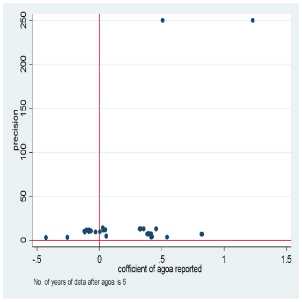
(d) 5 or more years after agoa
(e) 6 or more years after agoa
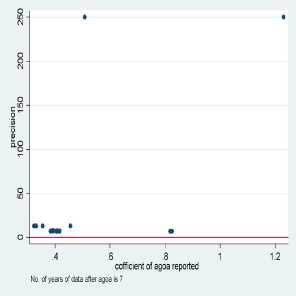
(f) 7 years after agoa
(g) 8 years after agoa
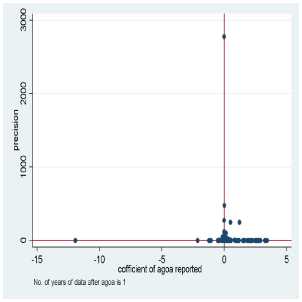
Figure 5: Precision vs. coefficient based on number of years after agoa
4 Results
Random Effects Meta-Analysis
In the analysis presented we excluded Mueller (2008) since it reported one coefficient and its inclusion did
affect results of the various MRAs. In addition, the coefficients from the first table of Tadesse, et al (2008)
were included in the analysis. The remaining tables in their paper reported similar (and in many case
the same) coefficients in Tadesse and Fayissa (2008). In two studies (Nouve and Staatz, 2003, Seyoum,
2007) probability values were reported instead of t-statistics or standard errors. Hence, the inverse of the
t-distribution was used to recover the t-statistics—the distribution of these imputed statistics are presented
More intriguing information
1. Second Order Filter Distribution Approximations for Financial Time Series with Extreme Outlier2. The name is absent
3. CGE modelling of the resources boom in Indonesia and Australia using TERM
4. Using Surveys Effectively: What are Impact Surveys?
5. The name is absent
6. The WTO and the Cartagena Protocol: International Policy Coordination or Conflict?
7. Announcement effects of convertible bond loans versus warrant-bond loans: An empirical analysis for the Dutch market
8. Studying How E-Markets Evaluation Can Enhance Trust in Virtual Business Communities
9. The name is absent
10. The name is absent