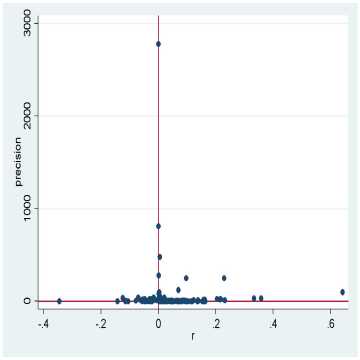
(a) Precision vs. correlation (all studies)
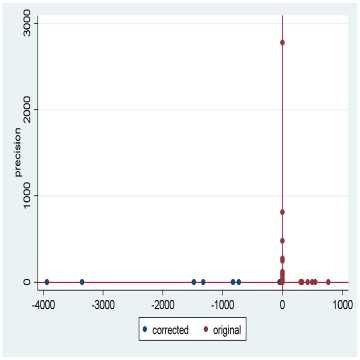
(b) precision vs. corrected coefficients
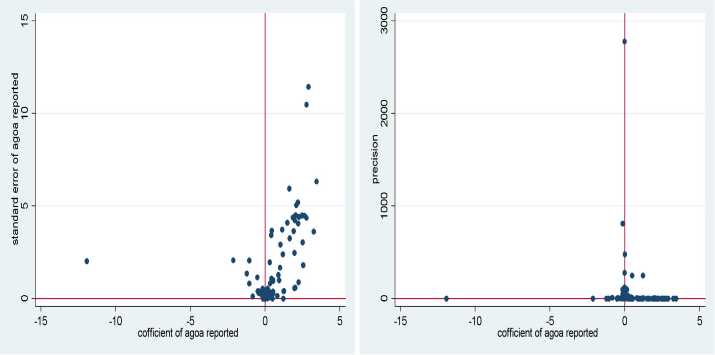
(c) Standard error vs. coefficient (excluding 6 large (d) Precision vs. coefficient (excluding 6 large values
values)
Figure 1: Funnel plots of agoa impact
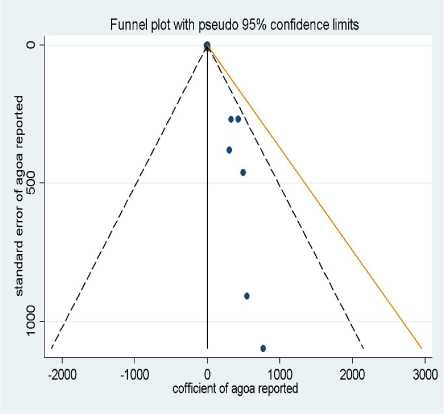
Figure 2: Standard error vs. coefficient based on Egger, et al. (1997) methodology
More intriguing information
1. Improving behaviour classification consistency: a technique from biological taxonomy2. Impact of Ethanol Production on U.S. and Regional Gasoline Prices and On the Profitability of U.S. Oil Refinery Industry
3. Text of a letter
4. Multi-Agent System Interaction in Integrated SCM
5. The name is absent
6. A production model and maintenance planning model for the process industry
7. The purpose of this paper is to report on the 2008 inaugural Equal Opportunities Conference held at the University of East Anglia, Norwich
8. The name is absent
9. Understanding the (relative) fall and rise of construction wages
10. Retirement and the Poverty of the Elderly in Portugal