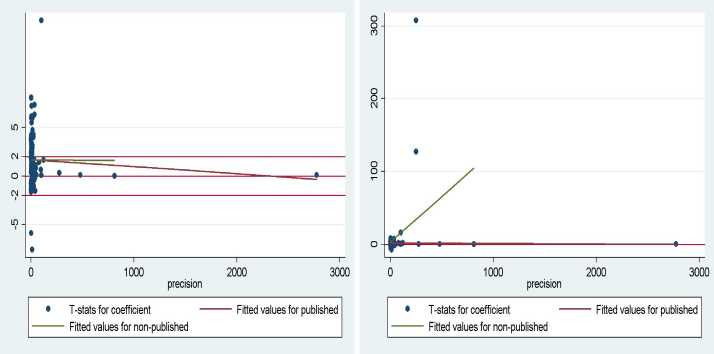
(a) precision vs. T-stats (6 large estimates excluded) (b) precision vs. T-stats (all estimates included)
Figure 3: Galbraith plots of agoa impact
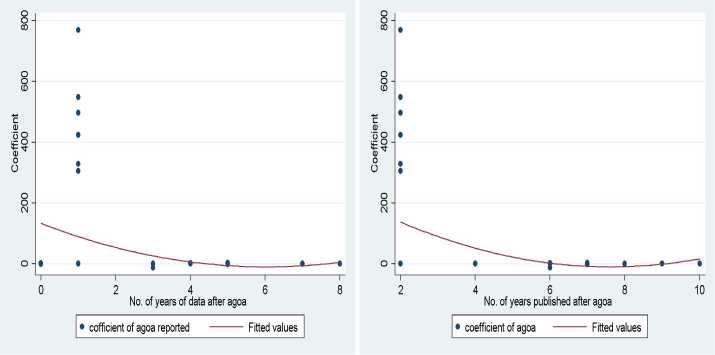
(a) coefficient vs. no. of years of data post agoa (b) cofficient vs. no. of years published post agoa
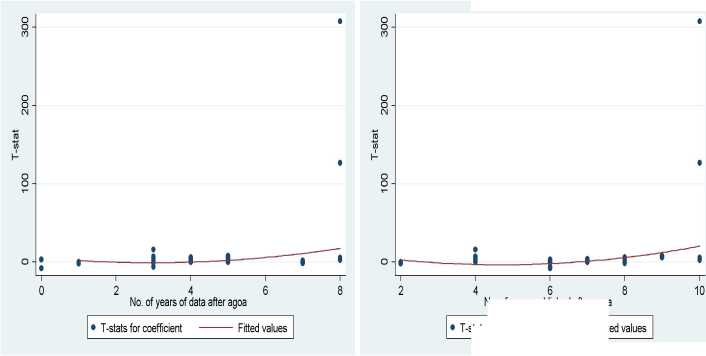
(c) t-statistics vs. no. of years of data post agoa (d) t-statistics vs. no. of years published post agoa
Figure 4: Relationship between years after agoa and coefficient/T-stat
No. of years published after agoa
Statsforcoefficient ----------Fitti
More intriguing information
1. NATURAL RESOURCE SUPPLY CONSTRAINTS AND REGIONAL ECONOMIC ANALYSIS: A COMPUTABLE GENERAL EQUILIBRIUM APPROACH2. Are class size differences related to pupils’ educational progress and classroom processes? Findings from the Institute of Education Class Size Study of children aged 5-7 Years
3. The Shepherd Sinfonia
4. Technological progress, organizational change and the size of the Human Resources Department
5. Critical Race Theory and Education: Racism and antiracism in educational theory and praxis David Gillborn*
6. The Provisions on Geographical Indications in the TRIPS Agreement
7. Quality Enhancement for E-Learning Courses: The Role of Student Feedback
8. The name is absent
9. The Environmental Kuznets Curve Under a New framework: Role of Social Capital in Water Pollution
10. IMMIGRATION AND AGRICULTURAL LABOR POLICIES