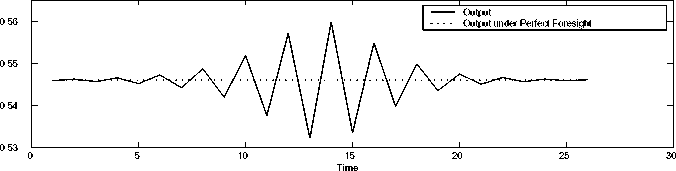
Figure 7: The Evolution of Output, Potential Output, and Output with Capital
Stock Held Fixed in Time.
0.56
0.55
0.54
----- Output
• ∙ ∙ ∙ Output under Perfect Foresight with Time Varying Capital Stock_
0.53
0
5
10
20
25
30
15
Time
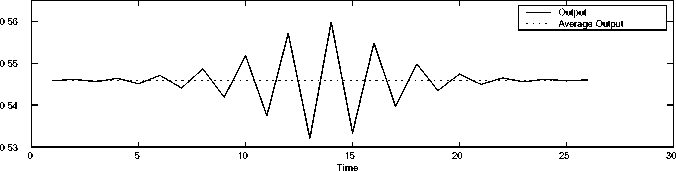
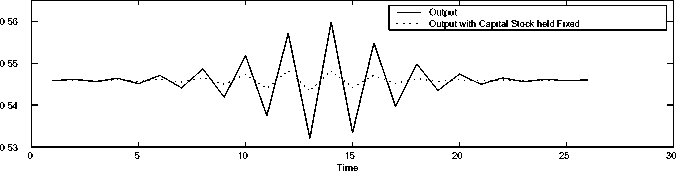
Figure 8: The Evolution of Output, Output under Perfect Foresight with Time
Varying Capital Stock, and the Average Level of Output.
30
More intriguing information
1. Labour Market Flexibility and Regional Unemployment Rate Dynamics: Spain (1980-1995)2. Benefits of travel time savings for freight transportation : beyond the costs
3. A Unified Model For Developmental Robotics
4. Graphical Data Representation in Bankruptcy Analysis
5. The name is absent
6. Deprivation Analysis in Declining Inner City Residential Areas: A Case Study From Izmir, Turkey.
7. Crime as a Social Cost of Poverty and Inequality: A Review Focusing on Developing Countries
8. The name is absent
9. The name is absent
10. The Impact of Financial Openness on Economic Integration: Evidence from the Europe and the Cis