Short-term Unemployment
Unemployment Rate
0.02
0
-0.02
-0.04
-0.06
-0.08
-0.1
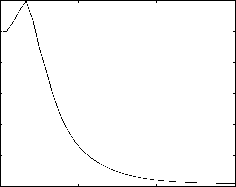
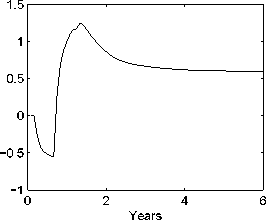
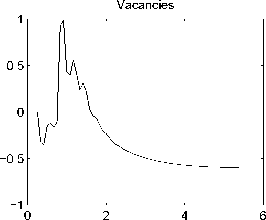
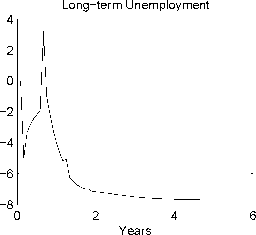
Fig. 1. Expansion in Labour Market Programs. (% Deviations from baseline.)
UOt
0246
’ US,t-1 + θUL,t-1
πL,t = θπS,t
where UOt = FUEV,t + FUEX,t + UNt
(8)
(9)
(10)
2.5 Job Creation and Destruction
The equations of motion that close the model are:
V It = Vt - Vt-1 + V OU,t + V OEX,t (11)
Ut = Ut-1 + FEUV,t + U IEX,t - FUEV,t - U OEX,t (12)
Et = Et-1 + FUEV,t + EIEX,t - FEU V,t - EOEX,t (13)
2.6 Calibration
The model is calibrated using Australian data for 1998 to produce a baseline
steady-state. The numerical values of the calibration are given in Table 4.
Figure 1 presents a step response for the model with an expansion in ALMPs
from the baseline 5% to 10%. The results are presented as deviations from the
baseline.
More intriguing information
1. Nonparametric cointegration analysis2. The name is absent
3. The name is absent
4. The name is absent
5. Solidaristic Wage Bargaining
6. The Impact of Financial Openness on Economic Integration: Evidence from the Europe and the Cis
7. Integrating the Structural Auction Approach and Traditional Measures of Market Power
8. Portuguese Women in Science and Technology (S&T): Some Gender Features Behind MSc. and PhD. Achievement
9. The name is absent
10. The name is absent