60
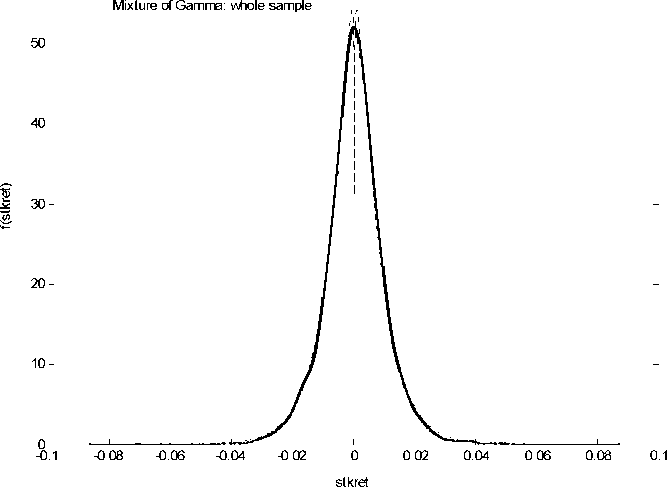
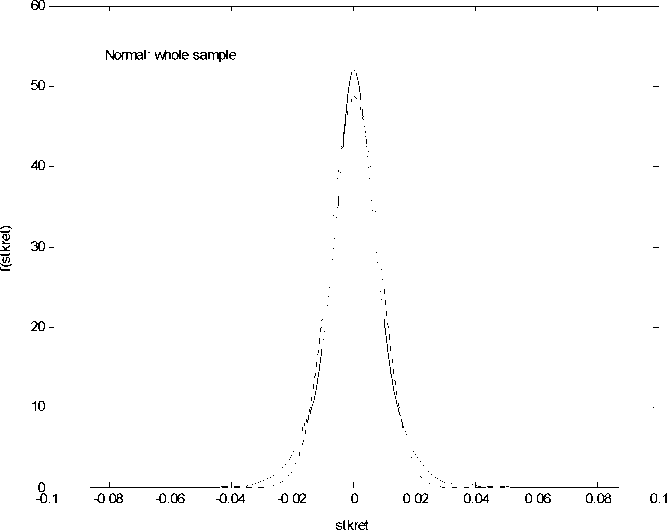
Figure 1 and 2 show the estimation result using the mixture of Gamma and the Normal
Distributions, for the entire sample. The solid line represents the nonparametric density,
the dotted line the parametric model.
More intriguing information
1. A Study of Adult 'Non-Singers' In Newfoundland2. How do investors' expectations drive asset prices?
3. RETAIL SALES: DO THEY MEAN REDUCED EXPENDITURES? GERMAN GROCERY EVIDENCE
4. Errors in recorded security prices and the turn-of-the year effect
5. Spectral calibration of exponential Lévy Models [1]
6. THE UNCERTAIN FUTURE OF THE MEXICAN MARKET FOR U.S. COTTON: IMPACT OF THE ELIMINATION OF TEXTILE AND CLOTHING QUOTAS
7. If our brains were simple, we would be too simple to understand them.
8. Public-private sector pay differentials in a devolved Scotland
9. NATURAL RESOURCE SUPPLY CONSTRAINTS AND REGIONAL ECONOMIC ANALYSIS: A COMPUTABLE GENERAL EQUILIBRIUM APPROACH
10. Subduing High Inflation in Romania. How to Better Monetary and Exchange Rate Mechanisms?