60
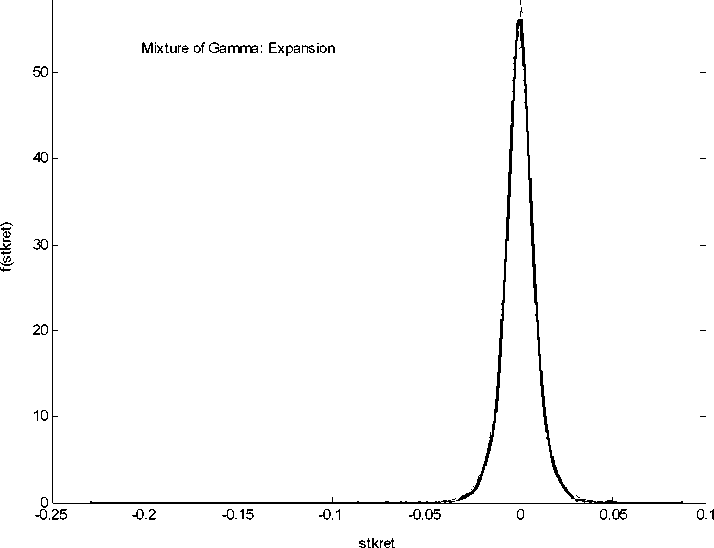
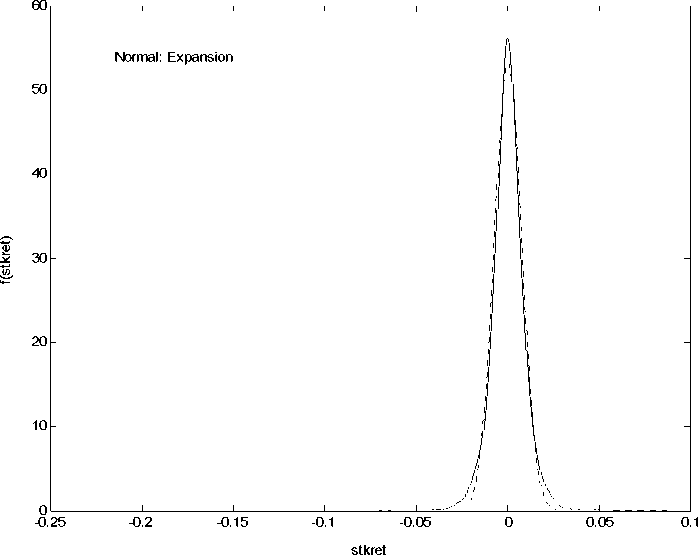
Figure 3 and 4 show the estimation result using the mixture of Gamma and the Normal
Distributions, for expansion sample. The solid line represents the nonparametric density,
the dotted line the parametric model.
More intriguing information
1. Skill and work experience in the European knowledge economy2. Firm Closure, Financial Losses and the Consequences for an Entrepreneurial Restart
3. An alternative way to model merit good arguments
4. The name is absent
5. The name is absent
6. Examining the Regional Aspect of Foreign Direct Investment to Developing Countries
7. Staying on the Dole
8. A THEORETICAL FRAMEWORK FOR EVALUATING SOCIAL WELFARE EFFECTS OF NEW AGRICULTURAL TECHNOLOGY
9. Optimal Vehicle Size, Haulage Length, and the Structure of Transport Costs
10. Survey of Literature on Covered and Uncovered Interest Parities