-0.03 -0.01 0.01 0.03 0.05 -0.08 -0.04 0.00 0.04 0.08 -0.30 -0.22 -0.14 -0.06 0.02 0.10 -0.4 -0.3 -0.2 -0.1 -0.0 0.1 0.2 -0.10 -0.02 0.06 0.10 0.14
US-Exports
US-Imports
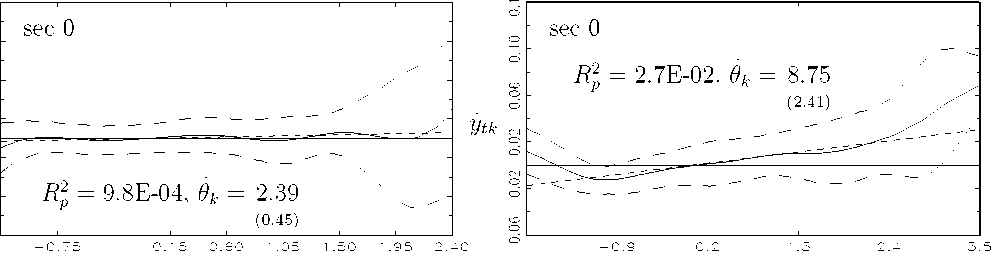
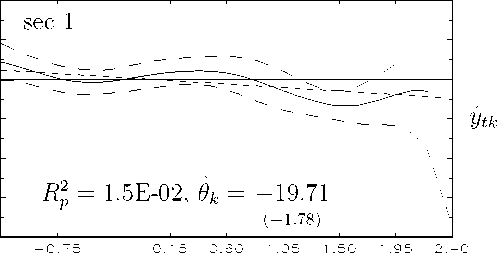
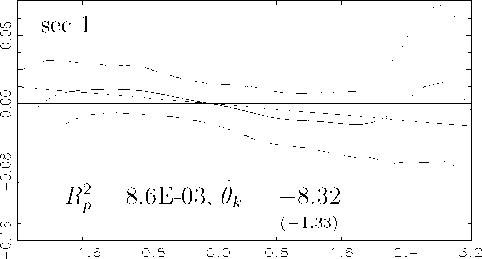
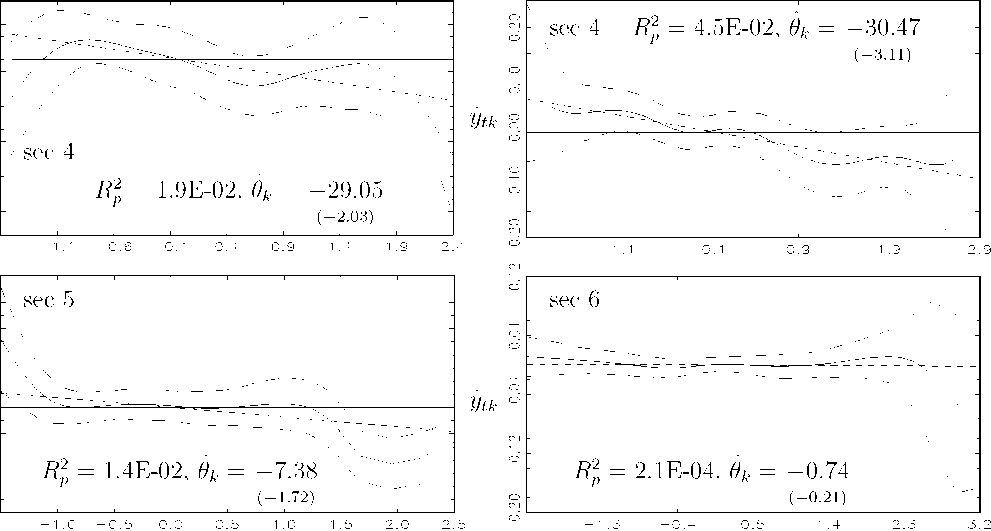
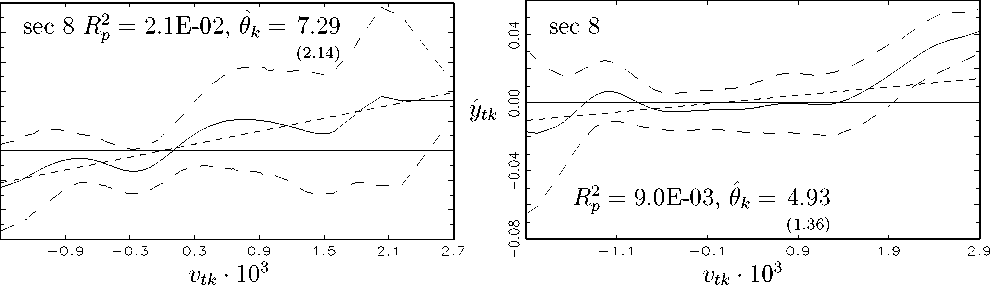
Figure 1: Linear (dashed) and semiparametric estimates (solid) of ytk = E[ytk∣vtk] for US
exports and imports in selected sectors. 95% confidence intervals for the semiparametric
estimates (wide dashes) and a horizontal line indicating E[ytk|vtk] = 0 are also shown. Rp2
is the partial degree of explantation, and θ is the slope estimate from the linear regression
(11) (t-ratios in parentheses).
More intriguing information
1. Feeling Good about Giving: The Benefits (and Costs) of Self-Interested Charitable Behavior2. The name is absent
3. THE ANDEAN PRICE BAND SYSTEM: EFFECTS ON PRICES, PROTECTION AND PRODUCER WELFARE
4. STIMULATING COOPERATION AMONG FARMERS IN A POST-SOCIALIST ECONOMY: LESSONS FROM A PUBLIC-PRIVATE MARKETING PARTNERSHIP IN POLAND
5. The name is absent
6. Bargaining Power and Equilibrium Consumption
7. The growing importance of risk in financial regulation
8. Permanent and Transitory Policy Shocks in an Empirical Macro Model with Asymmetric Information
9. Iconic memory or icon?
10. Mean Variance Optimization of Non-Linear Systems and Worst-case Analysis