Figure 10: Regression: RP-Power curves: Cauchy (a) n =10(b)
n = 20
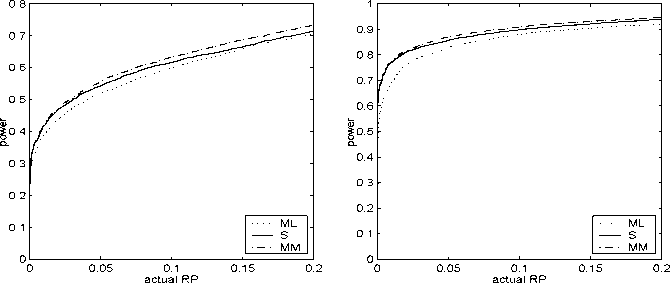
all replications. The sample size equals 10 or 20 for the Cauchy alternative,
and 50 and 100 in the case of vertical outliers. The RP-power curves are
constructed as explained in Section 6.1. In Figure 10 the RP-power curves
are plotted for the Cauchy alternative. As in the normal model, the IM tests
with robust estimators perform better than the IM test with ML estimator,
although the difference in power is minor. In the presence of 20% vertical
outliers lying at (a) Y =5whenn =50and(b)Y =5andY = -5 when
n = 100, the TB and MAD estimators yield much more powerful IM tests
than the ML estimator (see Figure 11). In this case, the 5%-level IM test
with the ML estimator is biased, meaning that the actual RP under the
null exceeds power. Figure 12 plots the RP-power curves for the case of
bad leverage points, with sample sizes equal to 50 and 100, and 10% and
5% bad leverage points, respectively. In both cases the IM test with robust
estimators has much more power, as expected. These simulation results
convincingly demonstrate the usefulness of robust estimators in a regression
context in connection with the IM test.
23
More intriguing information
1. The name is absent2. HEDONIC PRICES IN THE MALTING BARLEY MARKET
3. The name is absent
4. Economic Evaluation of Positron Emission Tomography (PET) in Non Small Cell Lung Cancer (NSCLC), CHERE Working Paper 2007/6
5. The Impact of Optimal Tariffs and Taxes on Agglomeration
6. The name is absent
7. The name is absent
8. The name is absent
9. Macro-regional evaluation of the Structural Funds using the HERMIN modelling framework
10. Infrastructure Investment in Network Industries: The Role of Incentive Regulation and Regulatory Independence