Figure 7: RP-Power curves: (a) n = 20, 2 outliers at 4 (b) n =20,
one outlier at -4, one outlier at 4
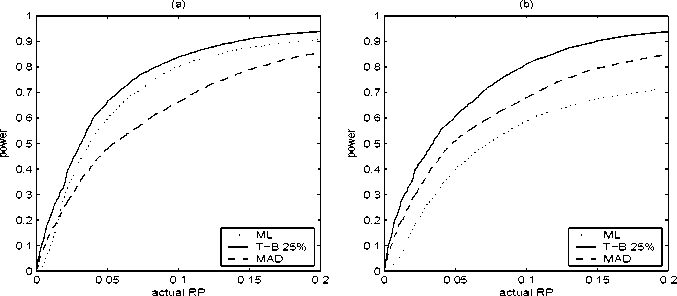
correct power for errors in rejection probability (ERP) 2 we plot power as
function of (actual) rejection probability under the null of correct specifi-
cation, as in Davidson and MacKinnon (1998). For pivotal statistics, such
an RP-power curve 3 is obtained as follows. Run R Monte Carlo replica-
tions under the null and under the alternative hypothesis. Order the R test
statistics obtained under the null from high to low to obtain T10 ≥ ... ≥ TR0 .
The power at actual RP k/(R + 1) is then estimated as the fraction of test
statistics generated under the alternative that are larger than Tk0 . Figure 7
plots the RP-power curves for n = 20, the alternative hypothesis being the
normal distribution contaminated with (a) two outliers at 4 and (b) one
outlier at -4andoneat4. From Figure 7 (a) it is clear that the IM test
with robust estimators may, but need not be, more powerful in the presence
of outliers than the IM test with ML estimator. As a second alternative hy-
pothesis we consider the Cauchy distribution. The RP-power curves for the
Cauchy distribution are plotted in Figure 8. As conjectured, the IM tests
with robust estimators have more power. A χ32 alternative is considered in
2The ERP of a test is the actual minus the nominal (i.e. chosen) probability of rejecting
the null when it is true.
3 Davidson and MacKinnon (1998) call this a size-power curve. Because the size of a
test, defined as the supremum, over the null, of the RP, often differs from the RP, we
prefer the term RP-power curve. In this particular model, however, the statistic is pivotal
and hence size equals RP.
21
More intriguing information
1. TLRP: academic challenges for moral purposes2. Design and investigation of scalable multicast recursive protocols for wired and wireless ad hoc networks
3. The name is absent
4. The name is absent
5. Consumption Behaviour in Zambia: The Link to Poverty Alleviation?
6. Response speeds of direct and securitized real estate to shocks in the fundamentals
7. Types of Tax Concessions for Promoting Investment in Free Economic and Trade Areas
8. Orientation discrimination in WS 2
9. Regional differentiation in the Russian federation: A cluster-based typification
10. Strategic Effects and Incentives in Multi-issue Bargaining Games