Figure 6:
(a) Power surface ML estimator; (b) difference ML
estimator-other
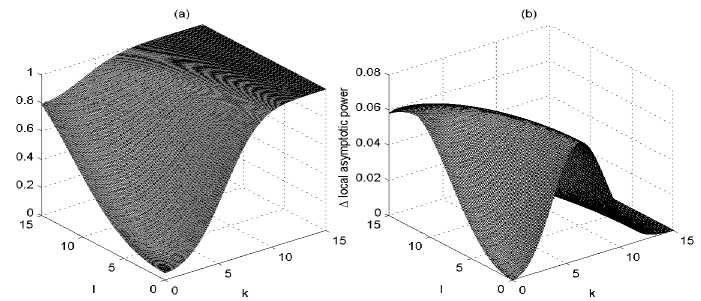
The power surface for the IM test with ML estimator is plotted in Fig-
ure 6 (a). The difference in power between the IM test with ML estimator
and the IM test with other M-estimators is plotted in Figure 6 (b). The
maximal difference in power is 0.06623. It is again observed that the loss in
local power when using robust estimators for the IM equality test is rather
limited.
5 The normal regression model
For the normal model with covariates, Fθ(y∣x) = σΦ(y X β) with θ =
(β',σ)'. We obtain, with u = (Y — X'β)/σ,
1 ( u2 — 1)vech( XX, )
m (X, Y ; θ) = 2 (u3 — 3u) X
σ u4 — 5u2 +2
where vech(■ ) is the lower triangular stack operator, and ξ = ξ(X, Y; θ),
1 / ( u2 — 1)vech( XX ' ) — σ IF( X, Y ; ^; K, Fθ ) Ek [vech( XX ' )]
ξ = 2 ( u3 — 3 u ) X
σ u4 — 5u2 + 2 — σIF(X,Y; ^; K,Fθ)
18
More intriguing information
1. Moffett and rhetoric2. The name is absent
3. The name is absent
4. Centre for Longitudinal Studies
5. The name is absent
6. IMPLICATIONS OF CHANGING AID PROGRAMS TO U.S. AGRICULTURE
7. The name is absent
8. How Low Business Tax Rates Attract Multinational Headquarters: Municipality-Level Evidence from Germany
9. An institutional analysis of sasi laut in Maluku, Indonesia
10. Sustainability of economic development and governance patterns in water management - an overview on the reorganisation of public utilities in Campania, Italy, under EU Framework Directive in the field of water policy (2000/60/CE)