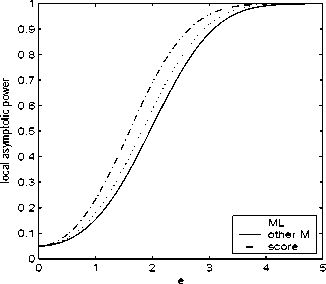
Figure 4: Power curves: Student’s t
Let S be the score test statistic, defined in the usual way. Under the
null hypothesis (p = ∞), S has a limiting χ2 distribution. Under Hn, as we
show in Appendix C.1,
S →d χ12(δ),
with non-centrality parameter
In conclusion, the score test and the IM tests have the same non-centrality
parameter in their limiting distribution. The power curves (as a function
of e) of 5%-level tests are given in Figure 4. The differences in power are
entirely due to differences in degrees of freedom: 1 for the score test, 2 for
the IM test with the ML estimator, and 3 for the IM test using any other
M-estimator. The difference in power between the IM tests is small.
4.3 Skewed normal alternative
Let Z — N(0, 1) and denote the distribution of ZI(Z ≤ 0) + (1 + γ) ZI(Z >
0) as FYk (Fernandez and Steel, 1998). Under the sequence of local alterna-
tives
Hn : Y
- Fn = Fesk√n,
15
More intriguing information
1. Aktive Klienten - Aktive Politik? (Wie) Läßt sich dauerhafte Unabhängigkeit von Sozialhilfe erreichen? Ein Literaturbericht2. The name is absent
3. Placentophagia in Nonpregnant Nulliparous Mice: A Genetic Investigation1
4. The name is absent
5. Modeling industrial location decisions in U.S. counties
6. The name is absent
7. THE CHANGING STRUCTURE OF AGRICULTURE
8. The name is absent
9. The role of statin drugs in combating cardiovascular diseases
10. The name is absent