Figure 1: Asymmetric contamination: non-centraiity parameter
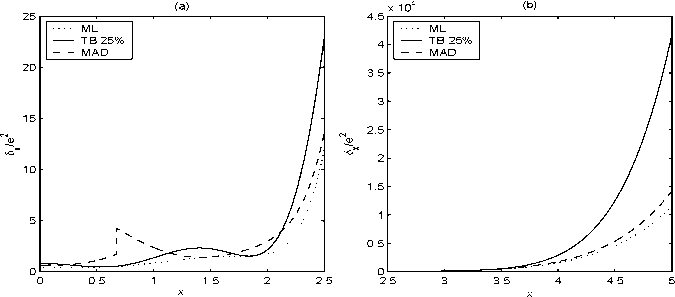
Note: right panel uses 104 as measurement unit on vertical axis
Figure 2: Symmetric contamination: non-centraiity parameter
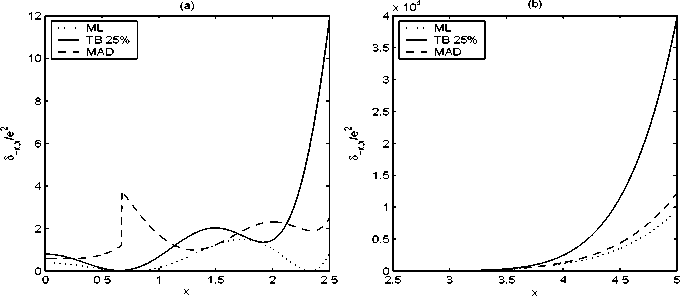
Note: right panel uses 104 as measurement unit on vertical axis
We see in both figures that the non-centrality parameter corresponding to
the ML estimator is uniformly smaller than those corresponding to the other
estimators, as shown. The non-centrality parameter associated with the
MAD estimator is discontinuous at x = Φ-1(3/4) = 0.6745, where also ρc(■ )
is discontinuous. Figure 3 gives the power curves of 5%-level IM tests with
level e contamination at x = 10, a clear outlier relative to the N (0, 1) distri-
13
More intriguing information
1. The name is absent2. L'organisation en réseau comme forme « indéterminée »
3. The economic doctrines in the wine trade and wine production sectors: the case of Bastiat and the Port wine sector: 1850-1908
4. Passing the burden: corporate tax incidence in open economies
5. Cultural Diversity and Human Rights: a propos of a minority educational reform
6. THE ECONOMICS OF COMPETITION IN HEALTH INSURANCE- THE IRISH CASE STUDY.
7. Convergence in TFP among Italian Regions - Panel Unit Roots with Heterogeneity and Cross Sectional Dependence
8. Telecommuting and environmental policy - lessons from the Ecommute program
9. The Impact of Individual Investment Behavior for Retirement Welfare: Evidence from the United States and Germany
10. Poverty transition through targeted programme: the case of Bangladesh Poultry Model