(a)
0 0.5 1 1.5 2 2.5
x 10 3
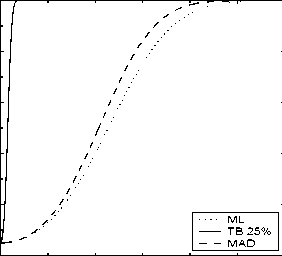
Figure 3: Power curves: (a) asymmetric contamination at x =10
and (b) symmetric contamination at x = -10, 10
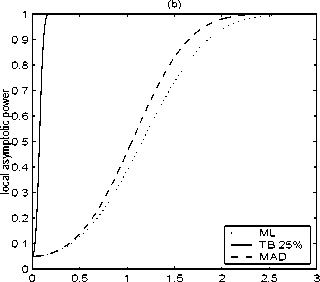
bution. The ordering is unambiguous: the IM test with the TB estimator is
far more powerful than with the MAD or ML estimator. Using the MAD is
slightly more powerful than using ML. The TB estimator with 25% break-
down point is a compromise between the ML estimator which is efficient but
has 0% breakdown point, and the MAD estimator, which has 50% break-
down point but is very inefficient. This compromise yields a more powerful
IM test.
4.2 Student’s t alternative
Consider the sequence of local alternatives
Hn : Y - Fn = Ft( .) ( e > 0)
where Ft(p) is the distribution function of a Student’s t variate with p degrees
of freedom. In Appendix B.1 it is shown that, under Hn,
T →d χq2 (δ)
with non-centrality parameter
δ
for all M-estimators of scale.
14
More intriguing information
1. Constrained School Choice2. Centre for Longitudinal Studies
3. The name is absent
4. The name is absent
5. The name is absent
6. Willingness-to-Pay for Energy Conservation and Free-Ridership on Subsidization – Evidence from Germany
7. The name is absent
8. A Brief Introduction to the Guidance Theory of Representation
9. Quality practices, priorities and performance: an international study
10. Cryothermal Energy Ablation Of Cardiac Arrhythmias 2005: State Of The Art