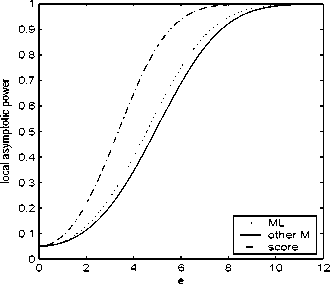
Figure 5: Power curves: Skewed normal
we have, as shown in Appendix B.2,
T →d χq2 (δ)
with non-centrality parameter
δ=
ɪ e e
4π
which is the same for all M-estimators of scale.
Regarding the score test, we show in Appendix C.2 that, under Hn,
S →d χ21 (δ),
with non-centrality parameter
δ=
e2.
The power curves of 5%-level tests are given in Figure 5. The score test
is now considerably more p owerful than the IM test, primarily due to the
larger non-centrality parameter. The difference between the different IM
tests is, again, rather small.
16
More intriguing information
1. NVESTIGATING LEXICAL ACQUISITION PATTERNS: CONTEXT AND COGNITION2. The name is absent
3. The name is absent
4. A novel selective 11b-hydroxysteroid dehydrogenase type 1 inhibitor prevents human adipogenesis
5. Mergers under endogenous minimum quality standard: a note
6. Retirement and the Poverty of the Elderly in Portugal
7. Economie de l’entrepreneur faits et théories (The economics of entrepreneur facts and theories)
8. The name is absent
9. Performance - Complexity Comparison of Receivers for a LTE MIMO–OFDM System
10. The English Examining Boards: Their route from independence to government outsourcing agencies