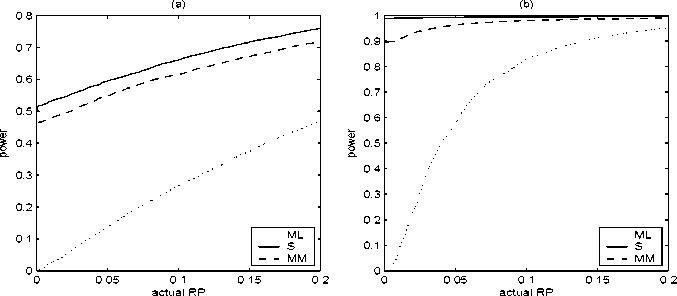
Figure 11: Regression: RP-Power curves: 20% Vertical outliers
(a) at Y = 5 (n = 50) (b) at Y = 5 and Y = -5 (n = 100)
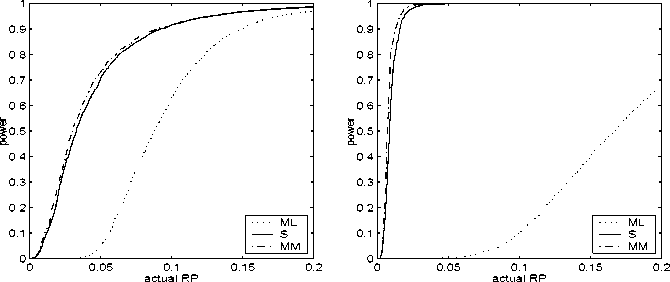
Figure 12: Regression: RP-Power curves: Bad leverage points:
(a) 5 points at X = (1 6),Y = 6 (n = 50); (b) 5 points at X =
(1 6), Y = 6 (n = 100)
7 Conclusion
We have studied the behaviour of the IM test when robust estimators re-
place the ML estimator in the construction of the test. Particular attention
has been given to the simplest of models, the normal location-scale model
without covariates, where the IM test with ML estimator reduces to the
24
More intriguing information
1. A novel selective 11b-hydroxysteroid dehydrogenase type 1 inhibitor prevents human adipogenesis2. Commitment devices, opportunity windows, and institution building in Central Asia
3. The name is absent
4. Palvelujen vienti ja kansainvälistyminen
5. The name is absent
6. Evidence of coevolution in multi-objective evolutionary algorithms
7. Second Order Filter Distribution Approximations for Financial Time Series with Extreme Outlier
8. Heterogeneity of Investors and Asset Pricing in a Risk-Value World
9. The name is absent
10. Social Balance Theory