XREAP2007-14
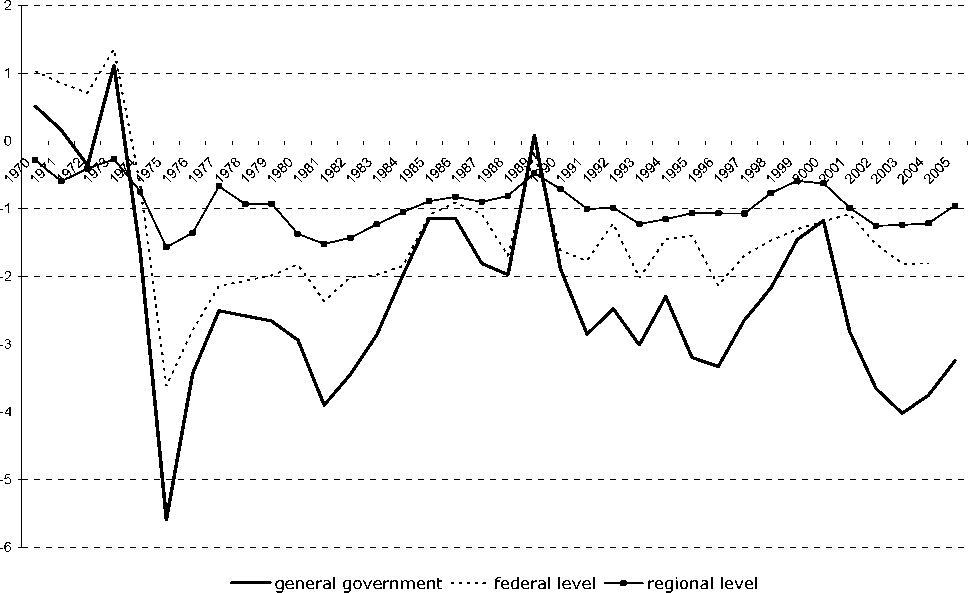
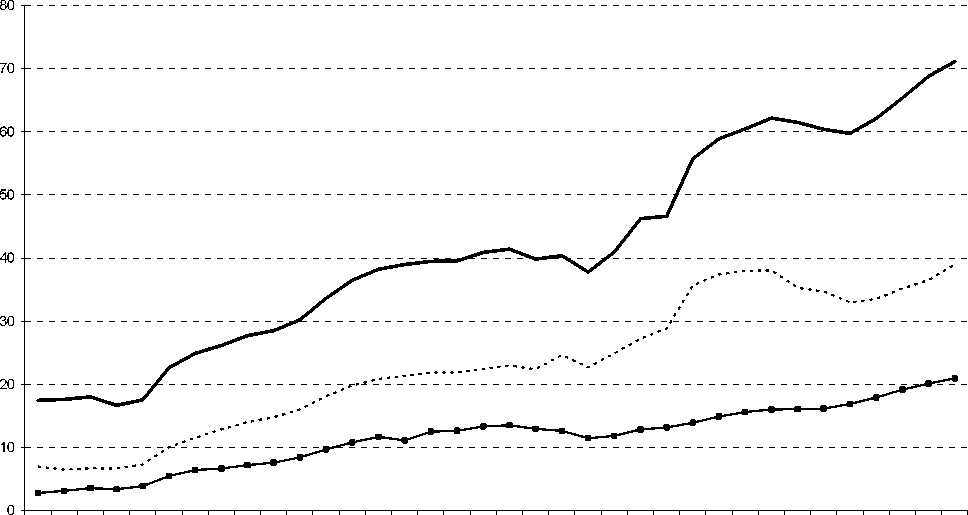
Figure 4. Germany, 1970-2005: fiscal series for government tiers.
(a) surplus to GDP ratio
(b) debt to GDP ratio
∕∖5^ Λ ʌʌ* A?* oζ4 θ(V о£Ь Q^c о$Э Q-P Q^ о$Ь Qv> C^ O^ cθz θɔɔ O^ς θ^ɔ ѻРθ∖ C^ æ' с$ Cs4 f∖V сФ cΨς e^ɔ
hO)κ hO)κ hO)κ hO)κ hO)κ hɑʌ hɑʌ hɑr hɑʌ hθ)κ hɑr hɑr hɑr hɑr hɑr hɑr κ⅛b h0r κ⅛b h<⅛b h<⅛d h<⅛d N⅛δ ><⅛d κ⅛δ ><⅛d ><⅛d ><⅛d ><⅛d h<⅛d
----general government.....federal level —■—regional level
26
More intriguing information
1. LAND-USE EVALUATION OF KOCAELI UNIVERSITY MAIN CAMPUS AREA2. The name is absent
3. The name is absent
4. The name is absent
5. The name is absent
6. The name is absent
7. Draft of paper published in:
8. Demographic Features, Beliefs And Socio-Psychological Impact Of Acne Vulgaris Among Its Sufferers In Two Towns In Nigeria
9. Improving the Impact of Market Reform on Agricultural Productivity in Africa: How Institutional Design Makes a Difference
10. Social Irresponsibility in Management