XREAP2007-14
Figure 2. United States, 1963-2000: fiscal series for government tiers.
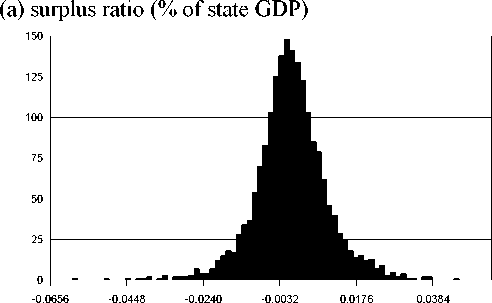
(a) surplus to GDP ratio (a) debt to GDP ratio
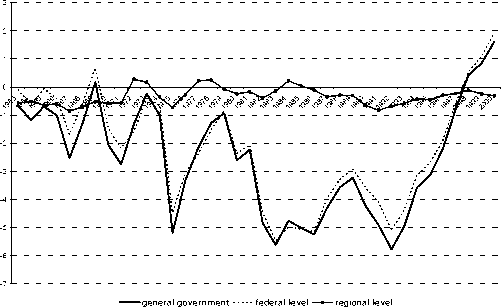
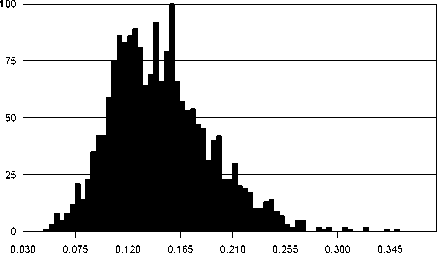
Figure 3. United States, 1963-200: histogram of fiscal data.

general government.....federal level ∙ regional level
(b) debt ratio (% of state GDP)
mean 0.05%
maximum 4.99%
minimum -6.54%
standard deviation 1.10%
skewness -0.14
kurtosis 5.60
|
mean |
14.22% |
|
maximum |
36.80% |
|
minimum |
3.34% |
|
standard deviation |
5% |
|
skewness |
0.68 |
|
kurtosis |
3.75 |
25
More intriguing information
1. Credit Market Competition and Capital Regulation2. The name is absent
3. THE ECONOMICS OF COMPETITION IN HEALTH INSURANCE- THE IRISH CASE STUDY.
4. The name is absent
5. Implementation of the Ordinal Shapley Value for a three-agent economy
6. The bank lending channel of monetary policy: identification and estimation using Portuguese micro bank data
7. Chebyshev polynomial approximation to approximate partial differential equations
8. Economies of Size for Conventional Tillage and No-till Wheat Production
9. The open method of co-ordination: Some remarks regarding old-age security within an enlarged European Union
10. Quality Enhancement for E-Learning Courses: The Role of Student Feedback