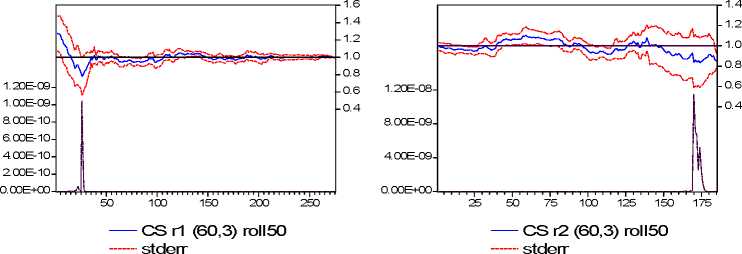
Campbell-Shiller regression for the maturity couple (60, 3); while, Figure 9.b (panel below) focuses
on the maturity pair (120, 3). Results are similar for other couples of maturities (n, 3).
---p-val --p-val
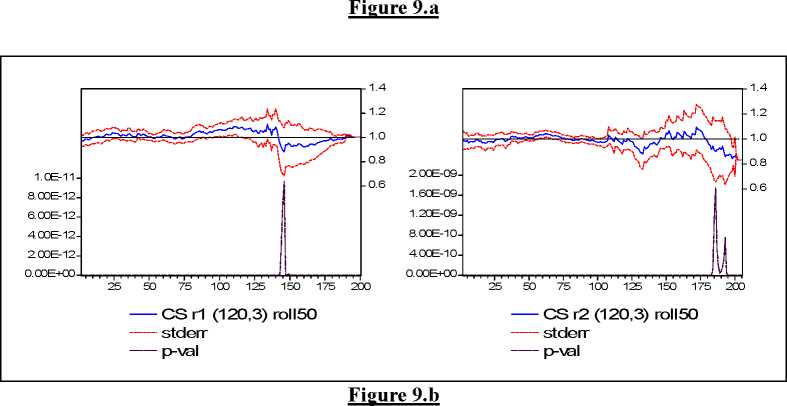
Table 8 shows some descriptive statistics of the estimated slope coefficient, obtained with rolling
regressions. The bottom part reports statistics computed over the entire sample (January 1964 - June
2002). The top part reports statistics worked out within each threshold regime. For any combination
of maturities (n, m), the mean of the estimated slope coefficient is very close to unity. Moreover, the
variability of βt is definitely lower in the sub-samples. In particular, the standard deviation of the
rolling βt estimates in the sub-regimes is approximately one-tenth of the standard deviation
computed in the single regime model.
23
More intriguing information
1. Mergers under endogenous minimum quality standard: a note2. The name is absent
3. Two-Part Tax Controls for Forest Density and Rotation Time
4. Making International Human Rights Protection More Effective: A Rational-Choice Approach to the Effectiveness of Ius Standi Provisions
5. Washington Irving and the Knickerbocker Group
6. Governance Control Mechanisms in Portuguese Agricultural Credit Cooperatives
7. The problem of anglophone squint
8. The Modified- Classroom ObservationScheduletoMeasureIntenticnaCommunication( M-COSMIC): EvaluationofReliabilityandValidity
9. Om Økonomi, matematik og videnskabelighed - et bud på provokation
10. AJAE Appendix: Willingness to Pay Versus Expected Consumption Value in Vickrey Auctions for New Experience Goods