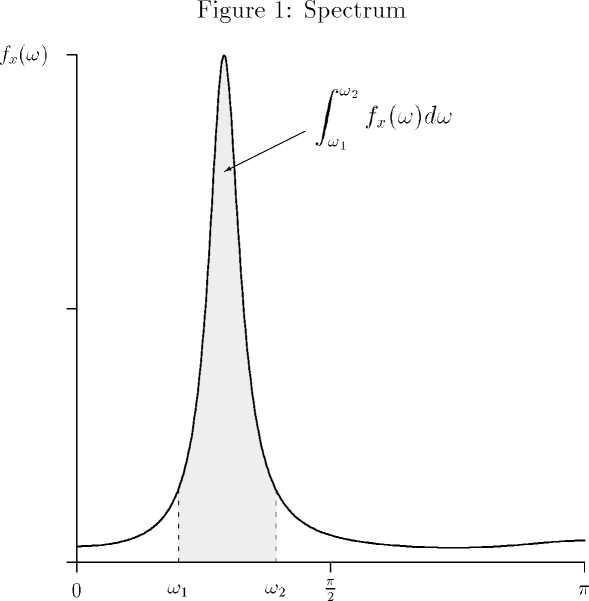
In other words, we can look at it as the plot of a decomposition of the variance
against frequencies in the interval [0,7r].5 After normalising the spectrum using
the variance 7i-(O), the area under the curve from ω1 to ω2 in Figure 1 is (half)
the share of total variance of Xf which can be attributed to the composite of the
waves in this range. Spectral analysis thus permits a natural decomposition of
a series into cyclical components defined over frequency bands we are interested
in. In terms of real wages, these may relate to 3- year wage contract cycles, 5-7
year business cycles and still longer cycles generated, for instance, by product
and process innovations.
2.2 Multivariate Measures
Identifying each of the multiple wage cycles that combine to produce the ob-
served wage time series does not in itself contain the most interesting infor-
mation from an economist’s viewpoint. To achieve this, we would need to
establish what each of the wages represents, if anything, from an economic
5Since the spectrum is an even function, it is not necessary to plot it in the entire range
[— 7Γ, 7Γ].
More intriguing information
1. A COMPARATIVE STUDY OF ALTERNATIVE ECONOMETRIC PACKAGES: AN APPLICATION TO ITALIAN DEPOSIT INTEREST RATES2. The name is absent
3. Migration and employment status during the turbulent nineties in Sweden
4. The name is absent
5. Markets for Influence
6. The name is absent
7. El impacto espacial de las economías de aglomeración y su efecto sobre la estructura urbana.El caso de la industria en Barcelona, 1986-1996
8. CROSS-COMMODITY PERSPECTIVE ON CONTRACTING: EVIDENCE FROM MISSISSIPPI
9. Innovation and business performance - a provisional multi-regional analysis
10. The Effects of Reforming the Chinese Dual-Track Price System