CAPACITY AND ASYMMETRIES IN MONETARY POLICY
39
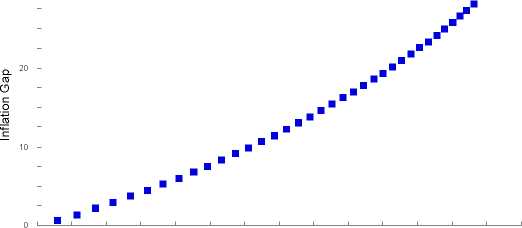
Capacity Gap
Note: Each point in the figure represent the cumulated increase in equilibriu
values of the capacity and inflation gap that results from a series of 1%
monetary policy shocks.
Figure 11: Pseudo Phillips Curve
IDEA-Departament d’Economia i Ii0Economica
E-mail address-, [email protected]
URL: http : //idea.uab.es/~palvarez/
More intriguing information
1. The name is absent2. The name is absent
3. Running head: CHILDREN'S ATTRIBUTIONS OF BELIEFS
4. L'organisation en réseau comme forme « indéterminée »
5. The name is absent
6. The name is absent
7. Neural Network Modelling of Constrained Spatial Interaction Flows
8. Dendritic Inhibition Enhances Neural Coding Properties
9. National urban policy responses in the European Union: Towards a European urban policy?
10. Deletion of a mycobacterial gene encoding a reductase leads to an altered cell wall containing β-oxo-mycolic acid analogues, and the accumulation of long-chain ketones related to mycolic acids